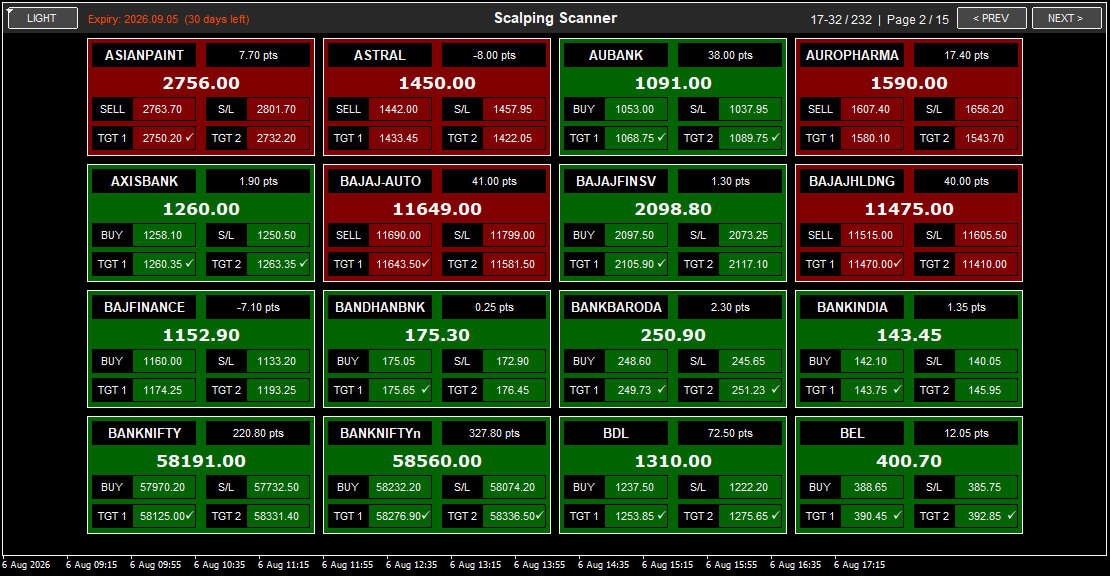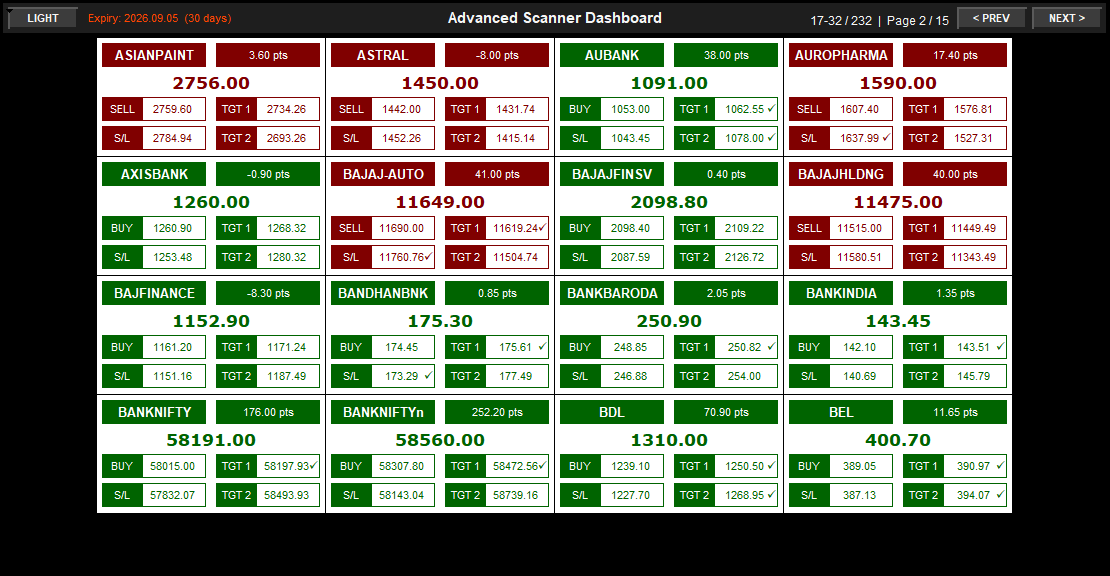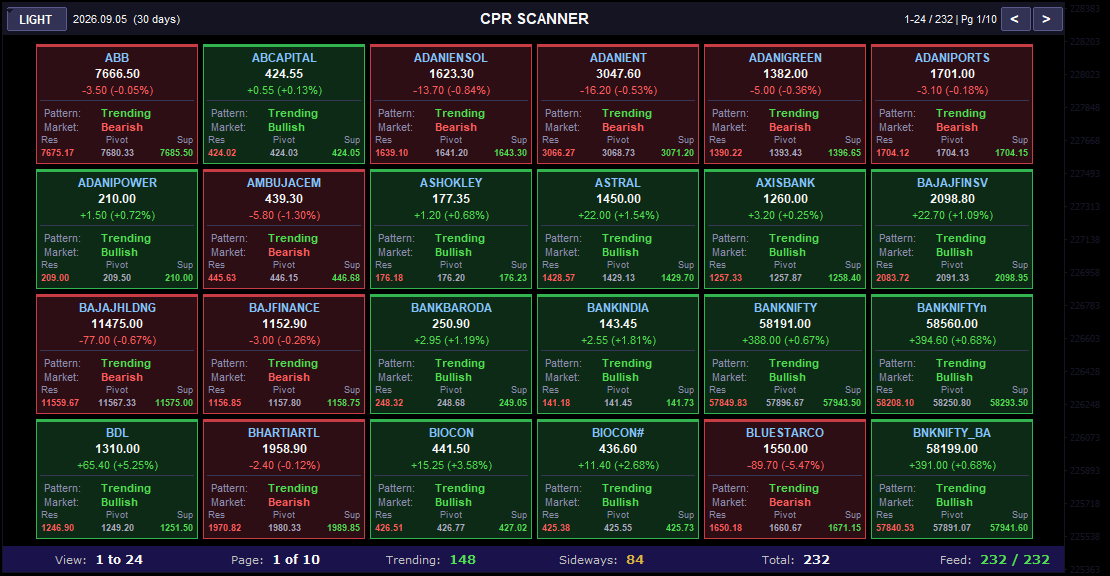

CPR Scanner is the ultimate Central Pivot Range analysis dashboard for traders who rely on pivot-based strategies with MT4 Data Feed capabilities. Scan 200+ symbols across paginated screens displaying 24 symbols per page in an organized 6x4 grid, with each card showing complete CPR analysis: Resistance, Pivot (Central Pivot), and Support levels, plus pattern type (Trending or Sideways) and market sentiment (Bullish or Bearish). Navigate through 10 pages using PREV/NEXT buttons, monitor 232 instruments simultaneously, and leverage real-time statistics showing how many symbols are trending (148) vs. sideways (84). Click any symbol card to instantly open a full chart view with the integrated Swing Trade indicator-featuring CPR, S&R, BG, and MW toggle buttons for comprehensive multi-layer analysis. Each dashboard card displays symbol name, current price, percentage change, and three critical CPR levels (Resistance with pivot/support values) for instant pivot positioning awareness. Perfect for swing traders and position traders who use Central Pivot Range to identify breakout zones, reversal areas, and trend continuation patterns. Features Light/Dark theme toggle, expiry tracking for derivatives, color-coded market sentiment (green Bullish, red Bearish), and organized statistics for market-wide pattern analysis. Whether you trade indices, stocks, forex, or commodities, CPR Scanner is your command center for systematic pivot-based trading with instant access to detailed chart analysis via Swing Trade indicator integration.
CPR Scanner transforms Central Pivot Range analysis from a time-consuming manual process into an instant, comprehensive market overview. This leverages MT4 Data Feed for optimal performance. Instead of calculating and plotting CPR levels on individual charts, this indicator automatically scans your entire watchlist (works with MT4 Data Feed across 200+ symbols), calculates CPR levels for each instrument, and presents everything in a clean, organized dashboard.
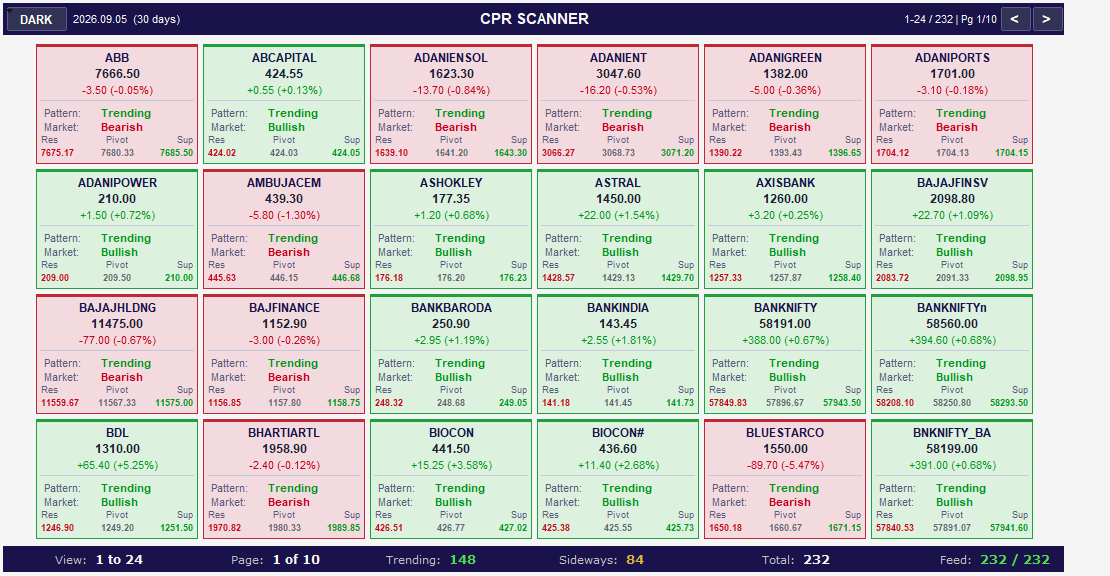
The 24-Symbol Dashboard displays more symbols per page than standard scanners (24 vs. 16), allowing you to view more market coverage with fewer page transitions. Each card in the 6x4 grid contains essential CPR information: symbol name, current price, percentage change, pattern type (Trending or Sideways), market sentiment (Bullish or Bearish), and three CPR levels-Resistance, Pivot, and Support-with exact numerical values. Color-coded text instantly communicates market direction: green for Bullish sentiment (price likely above CPR), red for Bearish sentiment (price likely below CPR).
The Statistics Bar at the bottom provides market-wide pattern analysis: "Trending: 148" shows how many symbols exhibit trending patterns, "Sideways: 84" shows consolidating symbols, and "Total: 232" displays your complete watchlist size. This aggregated view helps you understand overall market conditions-when 70%+ symbols show "Trending," markets are directional; when 50%+ show "Sideways," markets are consolidating.
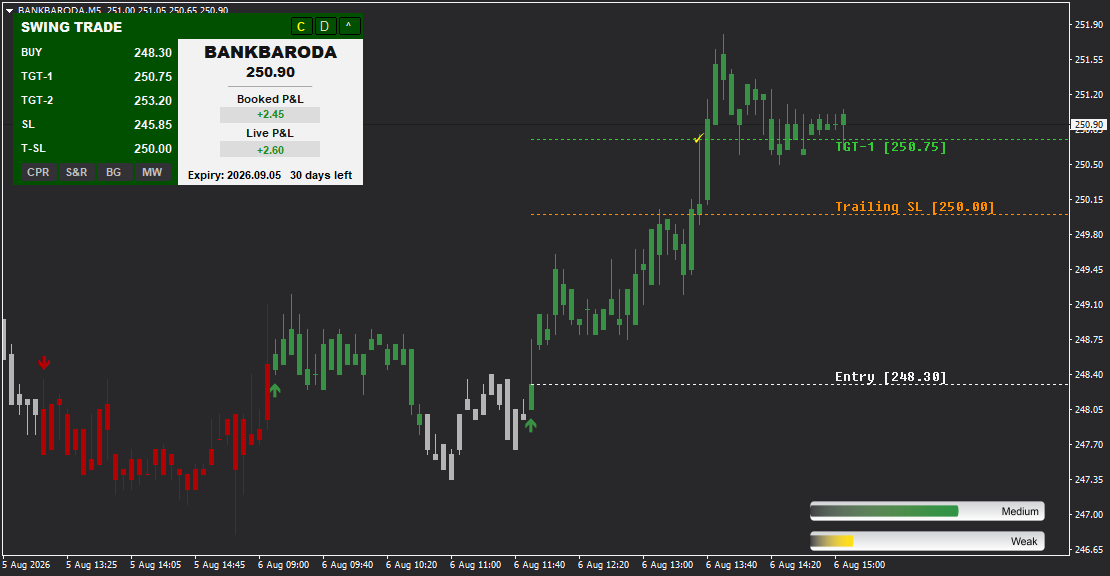
What makes CPR Scanner unique is its integration with the Swing Trade indicator. When you click any symbol card, the chart opens with Swing Trade pre-loaded, featuring four powerful toggle buttons: CPR (Central Pivot Range levels), S&R (Support & Resistance zones), BG (Background color zones for visual risk-reward), and MW (Market Watch for multi-symbol switching). This integration provides seamless workflow: scan CPR levels on dashboard - identify opportunity - click card - activate CPR toggle to see pivot lines plotted on chart - activate S&R toggle for additional support/resistance confirmation - activate BG toggle for visual trade planning - execute with confidence.
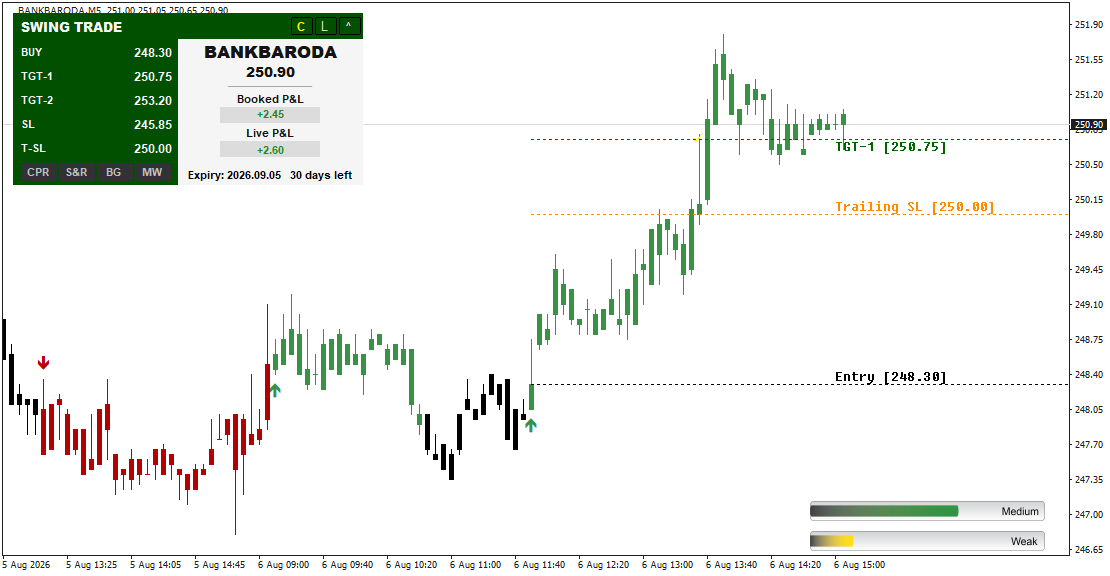
The chart view includes all Swing Trade features: entry markers (red X for BUY, red arrow for SELL), horizontal target lines (TGT-1, TGT-2), stop loss lines, Trailing Stop Loss, bottom dashboard showing trade parameters (Buy Entry, TGT-1, TGT-2, SL, T-SL, Status, Live P&L, Booked P&L), and strength indicators (Medium/Weak horizontal bars at bottom right).
Pattern Analysis on each card shows "Trending" for directional moves or "Sideways" for consolidation. This classification helps you filter signals: prioritize "Trending + Bullish" cards for BUY signals, "Trending + Bearish" cards for SELL signals, and avoid or reduce position sizes on "Sideways" symbols (choppy, range-bound markets).
Market Sentiment (Bullish/Bearish) is determined by price position relative to CPR levels. When price trades above Top Central (resistance), sentiment shows "Bullish." When price trades below Bottom Central (support), sentiment shows "Bearish." This instant feedback eliminates manual CPR calculation and positioning analysis.
The Pagination System organizes large watchlists efficiently. With 24 symbols per page across 10 pages, you can monitor 240 symbols (the example shows 232). The top bar displays "1-24 / 232 | Pg 1/10," showing you're viewing symbols 1-24 of 232 total on page 1 of 10. Use PREV/NEXT buttons to navigate-each click reveals 24 new opportunities.
CPR Scanner is designed for swing traders and position traders who hold trades for multiple days/weeks and rely on pivot levels for entry timing. Instead of spending 45-60 minutes calculating CPR for 50 symbols and plotting them manually, you scan 72 symbols (3 pages) in 5 minutes, identify 5-8 high-probability CPR setups, click through to view Swing Trade charts, and execute 2-3 best trades in under 20 minutes total.
The Light/Dark Theme toggle works across dashboard and chart views, and the Expiry Tracker monitors contract expiration for options/futures traders. Color-coded percentage changes help identify momentum: green positive percentages with Bullish sentiment = strong uptrend candidates, red negative percentages with Bearish sentiment = strong downtrend candidates.
FEATURE HIGHLIGHTS
- 24-Symbol Dashboard - Displays 24 symbols per page in organized 6x4 grid (more than standard 16-card layouts)
- CPR Analysis Cards - Each card shows Resistance, Pivot, Support levels with exact numerical values
- Pattern Classification - "Trending" or "Sideways" label on each card for instant pattern recognition
- Market Sentiment - "Bullish" or "Bearish" indicator (color-coded green/red) showing CPR positioning
- Statistics Bar - Shows "Trending: 148", "Sideways: 84", "Total: 232" for market-wide analysis
- Swing Trade Integration - Clicking symbol cards opens full chart with Swing Trade indicator pre-loaded
- Four Toggle Buttons - CPR, S&R, BG, MW buttons for multi-layer analysis in chart view
- Pagination System - Navigate through 10 pages (232 symbols total) with PREV/NEXT buttons
- Symbol Counter - Shows current viewing range (e.g., "1-24 / 232 | Pg 1/10")
- Clickable Symbol Cards - One-click access to detailed chart analysis with pivot levels plotted
- Current Price Display - Shows price and percentage change for each symbol
- Color-Coded Sentiment - Green text (Bullish), Red text (Bearish) for instant visual communication
- Light/Dark Theme Toggle - Consistent theme across dashboard and chart views
- Expiry Tracker - Displays contract expiration date and days remaining (derivatives)
- Complete Trade Setups - Chart view shows BUY/SELL, Entry, TGT-1, TGT-2, SL, Trailing SL
- Performance Tracking - Live P&L and Booked P&L visible in chart view
- Strength Indicators - Horizontal bars showing "Medium" and "Weak" trend strength
- CPR Toggle in Charts - Plots Top Central, Central Pivot, Bot. Central lines when activated
- S&R Toggle in Charts - Displays Resistance, Central Pivot, Support levels
- BG Toggle in Charts - Visual color zones (green targets, gray entry, black stop) for trade planning
- MW Toggle in Charts - Market Watch panel for quick symbol switching
- Watchlist Integration - Automatically scans all symbols in MT4 Market Watch
- Real-Time Updates - Dashboard refreshes continuously with latest prices and CPR levels
- Pivot-Based Trading - Purpose-built for traders using Central Pivot Range strategies
- Time-Saving Tool - Scan 72 symbols in 5 minutes (vs. 45-60 minutes manual CPR calculation)
RECOMMENDED APPROACH
Initial Setup:
1. Add all symbols you want to monitor to your MT4 Market Watch window
2. Attach CPR Scanner indicator to any chart-the dashboard appears automatically
3. Dashboard displays 24 symbols per page with CPR levels calculated for each
Dashboard Scanning Workflow:
Step 1: Understand the Statistics
Before scanning individual cards, review the Statistics Bar at the bottom:
- "Trending: 148" - 148 symbols showing directional patterns
- "Sideways: 84" - 84 symbols in consolidation/range-bound
- "Total: 232" - Your complete watchlist size
Market Condition Assessment:
- If Trending > 60% of Total (e.g., 148/232 = 64%) - Markets are directional, focus on trend-following trades
- If Sideways > 50% of Total - Markets consolidating, reduce position sizes or focus on range-bound strategies
- If Trending < 40% of Total - Choppy market, be cautious with new positions
Step 2: Scan Cards for High-Probability Setups
Look for "Trending + Bullish" Combinations (BUY Candidates):
- Pattern: "Trending"
- Market: "Bullish" (green text)
- Percentage change: Positive (green, e.g., +0.72%, +1.19%)
- Example from screenshot: ADANIPOWER (+1.50, +0.72%), ASHOKLEY (+1.20, +0.68%)
Look for "Trending + Bearish" Combinations (SELL Candidates):
- Pattern: "Trending"
- Market: "Bearish" (red text)
- Percentage change: Negative (red, e.g., -0.84%, -0.67%)
- Example from screenshot: ADANIENGSOL (-13.70, -0.84%), BAJAJHLDNG (-77.00, -0.67%)
Avoid "Sideways" Patterns:
- These symbols are consolidating (no clear trend)
- Higher risk of false signals
- If trading, use smaller position sizes
Step 3: Review CPR Levels on Cards
Each card shows three critical levels:
- Res (Resistance): Top boundary, with "Pivot" and "Sup" sub-labels showing values
- Second Line: Additional resistance or pivot level
- Third Line: Support level
Ideal BUY Setup (Price above CPR):
- Current price > Resistance value
- Market: "Bullish"
- Pattern: "Trending"
- Indicates strong breakout above CPR, continuation likely
Ideal SELL Setup (Price below CPR):
- Current price < Support value
- Market: "Bearish"
- Pattern: "Trending"
- Indicates strong breakdown below CPR, further decline likely
Marginal Setup (Price near CPR):
- Current price between Resistance and Support
- Market: "Bullish" or "Bearish"
- Pattern: "Trending" or "Sideways"
- Indicates price at pivot zone, wait for breakout confirmation
Step 4: Click Cards for Detailed Analysis
When you identify a promising setup (e.g., BANKBARODA showing "Trending + Bullish"):
1. Click the BANKBARODA card
2. Chart opens with Swing Trade indicator loaded
3. Activate CPR toggle (click CPR button on dashboard) - Top Central, Central Pivot, Bot. Central lines appear on chart
4. Activate S&R toggle - Resistance, Central Pivot, Support levels appear
5. Activate BG toggle - Color zones appear (green for targets, gray for entry, black for stop)
6. Review chart structure:
- Is price cleanly above Top Central (for BUY)?
- Is price cleanly below Bot. Central (for SELL)?
- Are entry, targets, and stop loss logically placed relative to CPR levels?
Step 5: Execute Trade
Execute if:
- - Dashboard shows "Trending + Bullish" (for BUY) or "Trending + Bearish" (for SELL)
- - Chart CPR toggle confirms price is above Top Central (BUY) or below Bot. Central (SELL)
- - S&R toggle shows support/resistance aligned with signal direction
- - BG toggle shows favorable risk-reward (large green zones vs. gray-to-black distance)
- - Strength indicator shows "Medium" (avoid "Weak" when possible)
Skip if:
- - Dashboard shows "Sideways" pattern
- - Price is between Top Central and Bot. Central (neutral zone, no clear breakout)
- - Chart structure looks choppy despite "Trending" label
- - Risk-reward is poor (small target distances relative to stop loss)
Step 6: Navigate to Next Page
After reviewing Page 1 (24 symbols):
1. Click NEXT > button
2. Page 2 appears with 24 new symbols (symbols 25-48)
3. Repeat scanning process
4. Continue until you've identified 5-8 high-probability setups
5. Click through top 3-5 to execute best 2-3 trades
Using the Four Toggle Buttons (Chart View):
CPR Toggle:
- Displays Top Central, Central Pivot, Bot. Central as horizontal lines on chart
- Use to confirm dashboard CPR analysis visually
- Price above Top Central = bullish bias confirmed
- Price below Bot. Central = bearish bias confirmed
S&R Toggle:
- Displays Resistance, Central Pivot, Support levels
- Provides additional confirmation beyond CPR
- BUY signals near Support = higher probability bounce
- SELL signals near Resistance = higher probability reversal
BG Toggle:
- Paints color zones on chart: green (targets), gray (entry), black (stop)
- Visual risk-reward assessment tool
- Large green zones vs. small gray-to-black distance = excellent trade
- Small green zones vs. large gray-to-black distance = poor trade
MW Toggle:
- Opens Market Watch panel with clickable symbol buttons
- Quick switching between symbols without returning to CPR Scanner dashboard
- Useful for monitoring multiple positions or scanning additional symbols
Recommended Timeframes:
- Swing Trading: Daily (D1), 4-Hour (H4) - Hold for days to weeks
- Position Trading: Weekly (W1) - Hold for weeks to months
- CPR levels are most effective on higher timeframes (H4, D1, W1)
Risk Management:
- Always place stop loss below Bot. Central (for BUY) or above Top Central (for SELL)
- Use Trailing SL once TGT-1 is achieved
- Reduce position size when pattern shows "Sideways"
- Avoid trades when Statistics Bar shows low Trending count (market-wide consolidation)
Example Workflow:
Scenario: Afternoon CPR Scanning Session
1. 2:00 PM - Open CPR Scanner
- Statistics Bar shows: Trending: 148, Sideways: 84, Total: 232
- Assessment: 64% trending (148/232) - Good market for directional trades
2. 2:02 PM - Scan Page 1 (24 symbols)
- Identify ADANIPOWER: +1.50 (+0.72%), Pattern: Trending, Market: Bullish
- Identify BANKBARODA: +2.95 (+1.19%), Pattern: Trending, Market: Bullish
- Identify BAJAJHLDNG: -77.00 (-0.67%), Pattern: Trending, Market: Bearish
3. 2:05 PM - Scan Page 2 (24 more symbols)
- Click NEXT - View symbols 25-48
- Identify 2-3 more trending candidates
- Total candidates identified: 5-6
4. 2:10 PM - Confirm BANKBARODA
- Click BANKBARODA card - Chart opens with Swing Trade
- Click CPR button - Lines appear: Top Central at ~247, Central Pivot at ~248.5, Bot. Central at ~250
- Current price: 250.90 (above Top Central) -
- Click S&R button - Resistance at ~253, Support at ~245
- Click BG button - Green zones large, gray-to-black distance small (good risk-reward) -
- Dashboard shows: BUY 248.30, TGT-1 250.75, TGT-2 253.20, SL 245.85
- Strength: Medium -
- Decision: Execute BUY
5. 2:15 PM - Execute Trade
- Enter BANKBARODA BUY at 248.30
- Place SL at 245.85 (below Bot. Central)
- TGT-1 at 250.75, TGT-2 at 253.20
- Book 50% at TGT-1, trail remaining 50%
6. 3:00 PM - Monitor Position
- Return to CPR Scanner dashboard
- Navigate to page with BANKBARODA
- Check for any alert or target hit updates
- Or click BANKBARODA card to view detailed chart
7. 3:30 PM - TGT-1 Achieved
- Live P&L shows +2.45 (TGT-1 hit)
- Book 50% position
- Move stop to breakeven or activate Trailing SL at 250.00
8. End of Day - Full Exit
- TGT-2 achieved at 253.20 or Trailing SL exits position
- Total session: 90 minutes, 1 trade executed, profitable
CPR (CENTRAL PIVOT RANGE) FUNDAMENTALS
What is CPR?
Central Pivot Range (CPR) is a powerful technical analysis tool that calculates three pivot levels based on previous period's High, Low, and Close prices. These levels act as support and resistance zones and help determine market bias for the current period.
Three CPR Levels:
1. Top Central (TC) / Resistance:
- Upper boundary of the CPR
- Acts as resistance when price is below
- Acts as support once broken upward
- Formula: (Pivot - Bot. Central) + Pivot
2. Central Pivot (CP):
- Middle pivot point, the core reference level
- Formula: (High + Low + Close) / 3
- Most important level-price oscillates around CP
3. Bottom Central (BC) / Support:
- Lower boundary of the CPR
- Acts as support when price is above
- Acts as resistance once broken downward
- Formula: (High + Low) / 2
How CPR Scanner Uses These Levels:
Each card on the CPR Scanner dashboard displays these three levels (labeled as Res, with Pivot/Sup sub-values). The scanner automatically calculates CPR for all symbols in your watchlist and presents them in an organized format.
Price Position Determines Bias:
Above Top Central - Bullish:
- Price has broken above the CPR
- "Market: Bullish" appears on card
- Indicates buying pressure is strong
- Ideal for BUY signals, target higher resistance levels
Below Bottom Central - Bearish:
- Price has broken below the CPR
- "Market: Bearish" appears on card
- Indicates selling pressure is strong
- Ideal for SELL signals, target lower support levels
Between TC and BC - Neutral:
- Price is within the CPR range
- Market sentiment unclear
- Wait for breakout above TC (bullish) or breakdown below BC (bearish)
- Avoid trading or use smaller position sizes
CPR Width Analysis:
Narrow CPR (TC and BC close together):
- Indicates potential trending day
- Expect strong directional move once breakout occurs
- High-priority trading opportunity
Wide CPR (TC and BC far apart):
- Indicates potential ranging day
- Price may oscillate between levels
- Lower-priority, consider range-bound strategies
Using CPR Scanner + Swing Trade Integration:
1. Dashboard Scan: Identify symbols with "Trending + Bullish" (price above TC) or "Trending + Bearish" (price below BC)
2. Click Card: Open chart with Swing Trade indicator
3. Activate CPR Toggle: Visualize TC, CP, BC lines on chart
4. Confirm Position: Verify price is clearly above TC (BUY) or below BC (SELL)
5. Execute: Enter trade with confidence, using BC as stop loss (for BUY) or TC as stop loss (for SELL)
CPR Trading Strategies:
1. Breakout Strategy:
- Dashboard shows symbol near Resistance level
- Click card - Activate CPR toggle
- Price breaks above Top Central with strong candle
- Enter BUY, target next resistance zone shown by S&R toggle
2. Breakdown Strategy:
- Dashboard shows symbol near Support level
- Click card - Activate CPR toggle
- Price breaks below Bottom Central with strong candle
- Enter SELL, target next support zone shown by S&R toggle
3. Retest Strategy:
- Price broke above TC yesterday, now retesting TC as support
- Dashboard shows "Trending + Bullish"
- Click card - CPR toggle shows price retesting TC line
- Enter BUY on successful retest (price bounces from TC), target previous high
4. Reversal Strategy:
- Price at extreme above/below CPR, showing exhaustion
- Dashboard shows "Trending + Bullish" but price extended far above TC
- Click card - Look for reversal signals (doji, hammer, etc.)
- Enter SELL (counter-trend) targeting return to TC/CP levels
STATISTICS BAR ANALYSIS GUIDE
Understanding the Statistics Bar:
The bottom bar on CPR Scanner dashboard provides aggregated market intelligence:
"View: 1 to 24"
- Shows which symbols are currently displayed (symbols 1-24)
- Changes as you navigate pages (e.g., "25 to 48" on Page 2)
"Page: 1 of 10"
- Shows current page number and total pages
- 24 symbols x 10 pages = 240 max symbols (example shows 232)
"Trending: 148"
- Number of symbols exhibiting trending patterns (directional movement)
- Calculated based on price action, volatility, and momentum indicators
- High Trending count (>60%) = strong directional market environment
"Sideways: 84"
- Number of symbols exhibiting sideways patterns (consolidation, range-bound)
- Calculated based on low volatility, choppy price action
- High Sideways count (>50%) = consolidating market, proceed with caution
"Total: 232"
- Total number of symbols in your watchlist being scanned
- CPR Scanner can handle 200+ symbols efficiently
"Feed: 232 / 232"
- Data feed status showing 232 symbols successfully scanned out of 232 total
- If this shows "200 / 232", it means 32 symbols failed to load data (check symbol availability)
How to Use Statistics for Market Context:
Scenario 1: Strong Trending Market
- Trending: 180, Sideways: 52, Total: 232
- Calculation: 180/232 = 78% trending
- Market Condition: Strong directional environment
- Trading Approach: Focus on trend-following trades, use full position sizes, hold for larger targets
- Priority: "Trending + Bullish" for BUY, "Trending + Bearish" for SELL
Scenario 2: Consolidating Market
- Trending: 70, Sideways: 162, Total: 232
- Calculation: 70/232 = 30% trending, 162/232 = 70% sideways
- Market Condition: Market-wide consolidation
- Trading Approach: Reduce position sizes, tighten stops, avoid new positions or focus on range-bound strategies
- Priority: Skip most trades, wait for market-wide breakout
Scenario 3: Mixed Market
- Trending: 120, Sideways: 112, Total: 232
- Calculation: 120/232 = 52% trending, 112/232 = 48% sideways
- Market Condition: Neutral, sectors diverging
- Trading Approach: Be selective, focus on strongest trending symbols (large positive/negative percentage changes)
- Priority: "Trending + Bullish/Bearish" with high percentage moves (>1%)
Scenario 4 (From Screenshot):
- Trending: 148, Sideways: 84, Total: 232
- Calculation: 148/232 = 64% trending
- Market Condition: Moderately strong trending environment
- Trading Approach: Good environment for directional trades, standard position sizes
- Priority: "Trending + Bullish/Bearish" combinations
Intraday Pattern Shifts:
Monitor Statistics Bar throughout the day:
- Morning (9:15-10:30 AM): Often shows high Trending count as market establishes direction
- Midday (11:00 AM-2:00 PM): May shift to higher Sideways count as consolidation sets in
- Afternoon (2:30-3:30 PM): May return to high Trending count as market makes final directional move
When Trending Count Changes:
- Increasing Trending Count: Market gaining momentum, add new positions
- Decreasing Trending Count: Market losing momentum, tighten stops, reduce new position sizes
DASHBOARD ANATOMY GUIDE
Top Bar Elements:
Left Side:
- LIGHT / DARK Toggle: Switch between light gray and dark blue/black background
- Current selection highlighted
Center:
- Expiry Tracker: "2026.09.05 (30 days)" shows contract expiration for derivatives
Center-Right:
- Title: "CPR SCANNER" in large bold text
Right Side:
- Symbol Counter: "1-24 / 232 | Pg 1/10" shows viewing range and page number
- < (PREV) Button: Navigate to previous page
- > (NEXT) Button: Navigate to next page
Symbol Card Anatomy (6x4 Grid = 24 Cards):
Top Row:
- Symbol Name: e.g., "ABB", "BANKBARODA", "BANKNIFTY" in large white text on dark background
- Price: e.g., "7666.50", "250.90" in extra-large bold text (center of card)
Second Row:
- Percentage Change: e.g., "-3.50 (-0.05%)", "+2.95 (+1.19%)"
- Green text for positive changes
- Red text for negative changes
Third Row:
- Pattern Label: "Pattern:" followed by status
- Pattern Value: "Trending" or "Sideways"
Fourth Row:
- Market Label: "Market:" followed by sentiment
- Market Value: "Bullish" (green) or "Bearish" (red)
Fifth, Sixth, Seventh Rows (CPR Levels):
- Res: Resistance level with sub-labels "Pivot" and "Sup" showing values
- Example: "Res 7657.17 | Pivot 7680.33 | Sup 7685.50"
- Second Res Line: Additional resistance level
- Example: "Res 424.02 | Pivot -- | Sup 424.05"
- Third Res Line: Support level or additional pivot
- Example shown varies by symbol
Color Coding:
- Card Background: Dark gray/black (Dark theme) or light pink/light green (Light theme)
- Light theme: Red/pink background for Bearish, Light green background for Bullish
- Text Colors:
- White for labels and symbol names
- Green for positive values and "Bullish"
- Red for negative values and "Bearish"
Bottom Bar (Statistics):
Left Section:
- "View: 1 to 24" - Current symbol range displayed
Center-Left:
- "Page: 1 of 10" - Current page and total pages
Center:
- "Trending: 148" - Count of trending symbols
Center-Right:
- "Sideways: 84" - Count of sideways symbols
Right-Center:
- "Total: 232" - Total symbols in watchlist
Far Right:
- "Feed: 232 / 232" - Data feed status
CHART VIEW INTEGRATION GUIDE
When You Click a Symbol Card:
The system automatically:
1. Opens a new chart window for that symbol (or switches to existing)
2. Loads the Swing Trade indicator with pre-configured settings
3. Displays complete dashboard with four toggle buttons: CPR, S&R, BG, MW
Swing Trade Dashboard (Top-Left):
Title Bar:
- "SWING TRADE" in green background
- Symbol name and current price (e.g., "BANKBARODA 250.90")
Trade Parameters:
- BUY / SELL: Signal type and entry price (e.g., "BUY 248.30")
- TGT-1: First target (e.g., "250.75")
- TGT-2: Second target (e.g., "253.20")
- S/L: Stop loss (e.g., "245.85")
- T-SL: Trailing stop loss (e.g., "250.00")
Four Toggle Buttons:
- CPR: Click to display Central Pivot Range levels on chart (TC, CP, BC lines)
- S&R: Click to display Support & Resistance levels (Resistance, Central Pivot, Support lines)
- BG: Click to activate Background color zones (green for targets, gray for entry, black for stop)
- MW: Click to open Market Watch panel with clickable symbol buttons
Performance Tracking:
- Booked P&L: Realized profit (e.g., "+2.45" in green)
- Live P&L: Unrealized profit (e.g., "+2.60" in green)
Display Controls:
- Expiry: "2026.09.05 | 30 days left"
Chart Canvas:
Visual Elements:
- Entry Marker: Green arrow up (BUY) or red arrow down (SELL)
- Horizontal Lines: Dotted lines for Entry, TGT-1, TGT-2, SL, Trailing SL (color-coded and labeled)
- CPR Lines (when CPR toggle active): TC, CP, BC horizontal lines
- S&R Lines (when S&R toggle active): Resistance, Central Pivot, Support horizontal lines
- Background Zones (when BG toggle active): Color-coded zones across chart
Bottom-Right:
- Strength Indicators: Two horizontal bars
- "Medium" bar (green) showing trend strength
- "Weak" bar (yellow) showing weak momentum
Workflow Example:
Scanning - Confirmation - Execution:
1. CPR Scanner Dashboard:
- See BANKBARODA: 250.90, +2.95 (+1.19%), Pattern: Trending, Market: Bullish
- CPR levels: Res 248.32, Pivot 248.88, Sup 249.05
- Current price (250.90) > Resistance (249.05) - Price above CPR -
2. Click BANKBARODA Card:
- Chart opens with Swing Trade indicator
3. Activate CPR Toggle:
- Click CPR button - TC, CP, BC lines appear on chart
- Visually confirm price is trading above Top Central
- TC line acts as support for current uptrend
4. Activate S&R Toggle:
- Click S&R button - Resistance, Central Pivot, Support lines appear
- Additional confirmation of key levels
- Resistance at ~253 aligns with TGT-2 (253.20)
5. Activate BG Toggle:
- Click BG button - Color zones appear
- Green zones (TGT-1 and TGT-2 areas) are large
- Gray-to-black distance (Entry to SL) is moderate
- Visual risk-reward assessment: Favorable -
6. Review Trade Setup:
- BUY Entry: 248.30 (near CPR support)
- TGT-1: 250.75 (current price area, achievable)
- TGT-2: 253.20 (near S&R resistance, good target)
- SL: 245.85 (below BC, protects against CPR breakdown)
- Strength: Medium (good momentum)
7. Execute Trade:
- Enter BUY at 248.30
- Place stop at 245.85
- Book 50% at TGT-1 (250.75)
- Trail remaining 50% with T-SL (250.00)
Toggle Button Benefits:
CPR Toggle:
- Validates dashboard CPR analysis visually on chart
- Shows exact TC, CP, BC line positions
- Helps identify entry timing (buy at BC bounce, sell at TC rejection)
S&R Toggle:
- Provides additional support/resistance levels beyond CPR
- Helps set realistic profit targets
- Confirms key reversal zones
BG Toggle:
- Visual risk-reward assessment in seconds
- Large green zones = high profit potential
- Small gray-to-black distance = low risk exposure
- Makes trade quality immediately obvious
MW Toggle:
- Quick switching to other symbols without returning to CPR Scanner
- Monitor multiple positions rapidly
- Discover related opportunities (e.g., other banking stocks if BANKBARODA is strong)
TECHNICAL SPECIFICATIONS
Indicator Type: CPR-focused multi-symbol scanning dashboard with Swing Trade indicator integration
Scan Capacity: 200+ symbols (232 shown in example)
Display Format: 24 symbols per page in 6x4 grid layout (more than standard 16-card displays)
Pagination: PREV/NEXT navigation with page counter (e.g., "Page 1 of 10")
CPR Analysis: Displays Resistance, Pivot, Support levels for each symbol
Pattern Classification: "Trending" or "Sideways" pattern identification
Market Sentiment: "Bullish" or "Bearish" based on CPR positioning
Statistics Bar: Shows Trending count, Sideways count, Total symbols, Feed status
Integration: Clickable cards open full charts with Swing Trade indicator pre-loaded
Four Toggle Buttons: CPR, S&R, BG, MW for multi-layer analysis in chart view
Signal Types: BUY and SELL with dual targets (TGT-1, TGT-2)
Stop Loss System: Fixed SL + Adaptive Trailing SL
Performance Tracking: Real-time Live P&L (unrealized) and Booked P&L (realized)
Expiry Tracking: Contract expiration date and days remaining display
Visual Aids: Entry markers, horizontal level lines, CPR/S&R lines, color zones, strength bars
Theme Options: Light and Dark background toggle (dashboard and chart)
Card Elements: Symbol name, price, percentage change, pattern, market, 3 CPR levels
Color Coding: Green (Bullish/positive), Red (Bearish/negative)
Watchlist Source: Automatically scans all symbols in MT4 Market Watch window
Real-Time Updates: Dashboard refreshes continuously with latest prices and CPR calculations
Market Coverage: Indices, stocks, forex, commodities, options, futures
Platform: MetaTrader 4 (MT4).