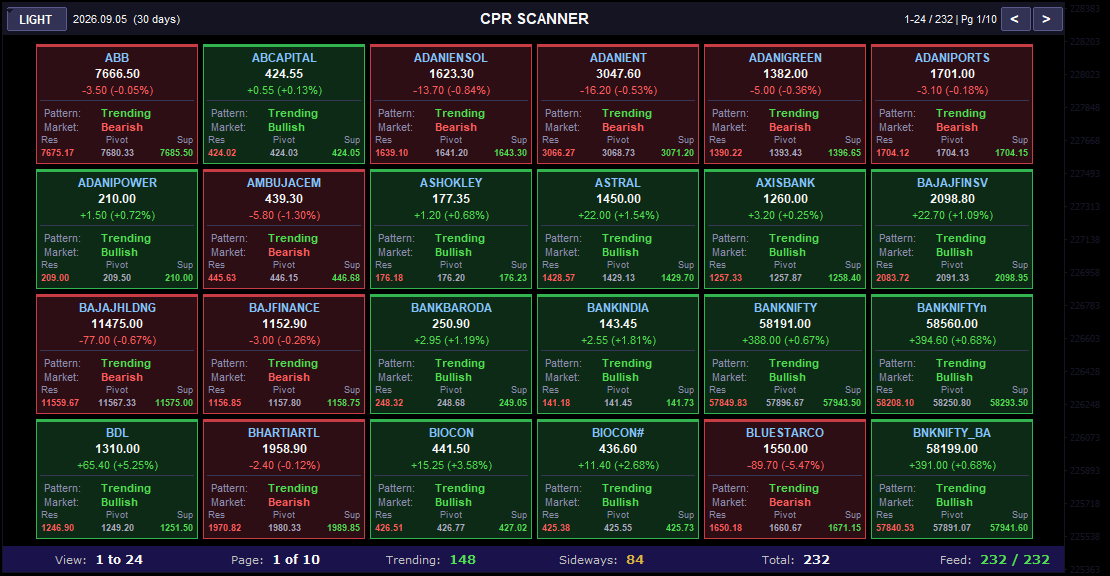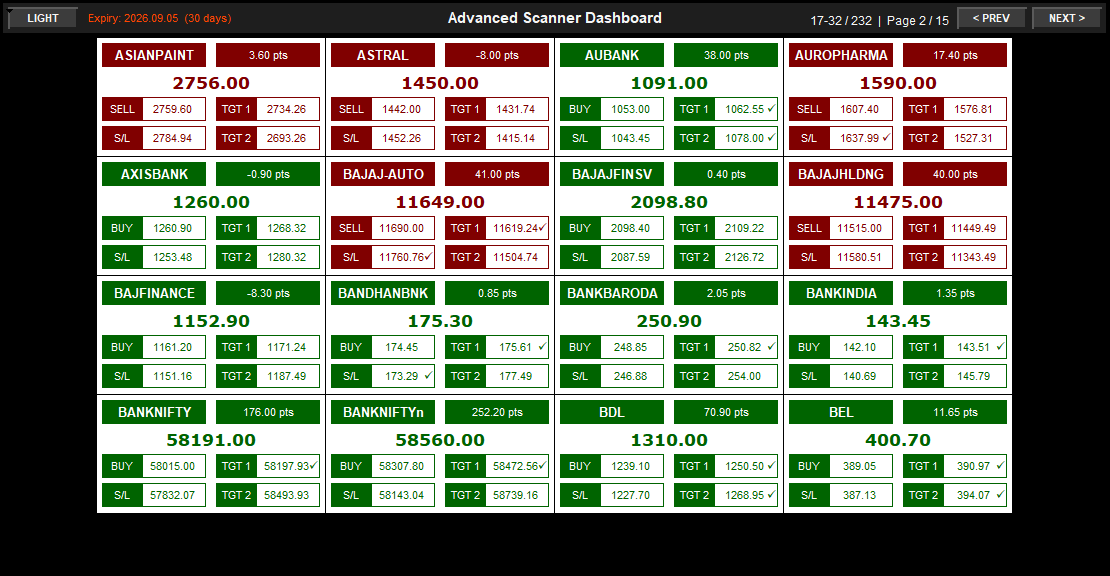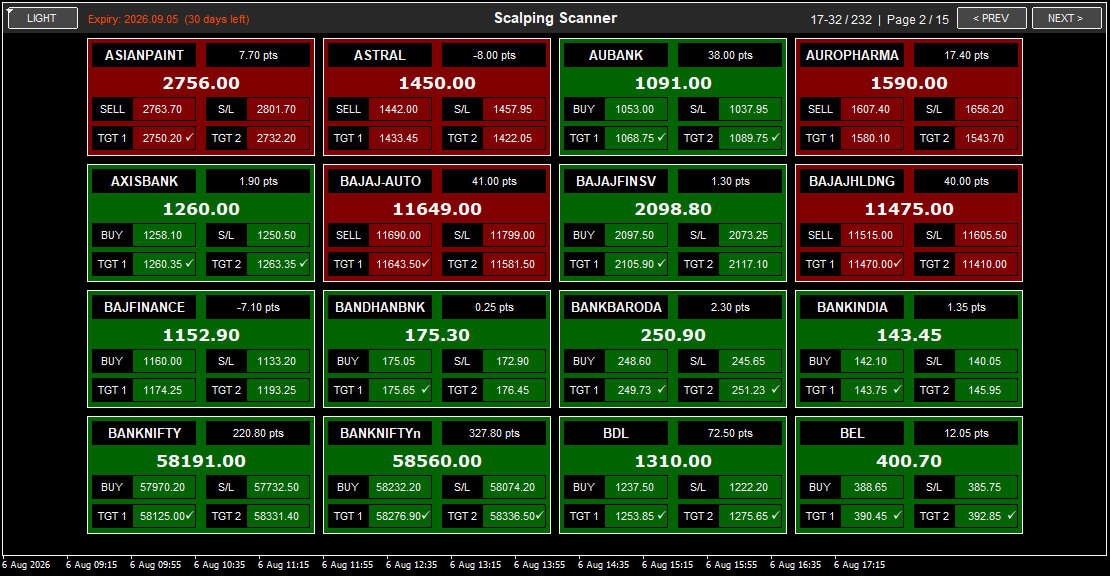

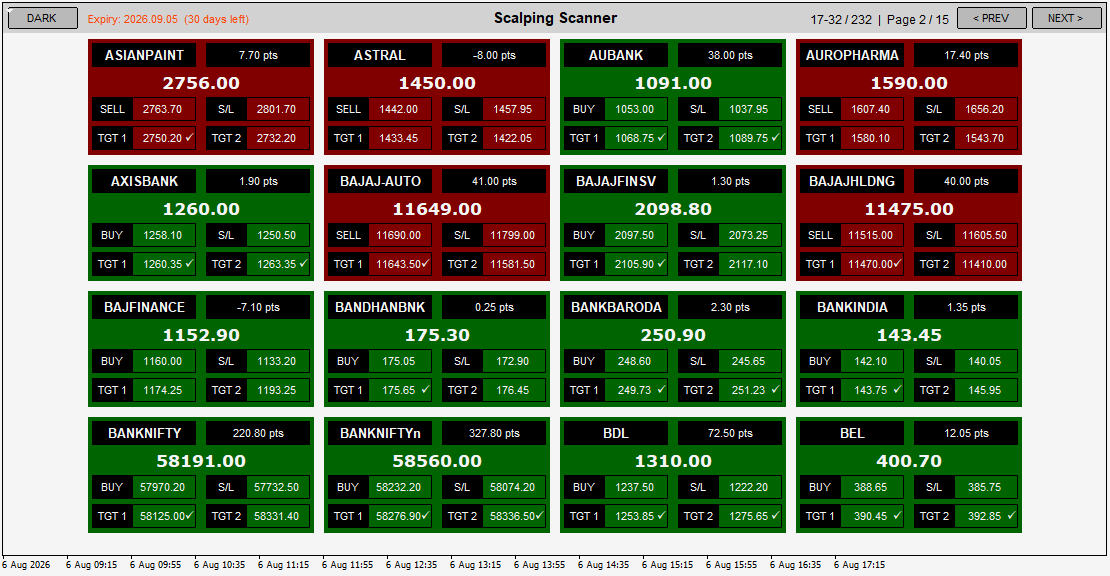
Scalping Scanner is the ultimate command center for fast-paced traders, combining a powerful multi-symbol dashboard with advanced multi-timeframe analysis in one seamless tool with MT4 Data Feed capabilities. Scan 200+ symbols across paginated screens (16 symbols per page), identify high-probability scalping opportunities in seconds, and click any symbol card to instantly open a full chart view with the integrated Scalping Trend indicator-complete with a 9-timeframe Trend Scanner panel (M1 through Monthly) for confirmation. Each dashboard card displays complete trade setups: BUY/SELL signal, entry price, dual targets (TGT 1, TGT 2), stop loss, current price, and points change. Navigate through pages using PREV/NEXT buttons, monitor 232+ instruments simultaneously, and leverage real-time target achievement indicators (- checkmarks) to track performance. When you click a symbol card, the chart opens with the Trend Scanner panel visible-showing UP/DOWN status across 9 timeframes plus overall Strength (Neutral/Bullish/Bearish)-enabling you to validate signals with multi-timeframe confirmation before executing trades. Perfect for scalpers who need both broad market scanning AND detailed technical analysis. Features Light/Dark theme toggle, CC-ON/OFF color-coded candles, expiry tracking for derivatives, and organized pagination for managing massive watchlists. Whether you trade indices, stocks, forex, or commodities, Scalping Scanner is your all-in-one solution for systematic, high-speed, multi-symbol scalping.
Scalping Scanner revolutionizes fast-paced trading by merging two critical needs into one powerful indicator: comprehensive market scanning across works with MT4 Data Feed across 200+ symbols and detailed multi-timeframe analysis for every opportunity. This leverages MT4 Data Feed for optimal performance. This dual-layer approach eliminates the time-consuming workflow of scanning charts manually, then loading indicators separately-Scalping Scanner does both automatically.
The Multi-Symbol Dashboard displays 16 symbols per page in a clean 4x4 grid layout. Each card shows essential information: symbol name, current price (large central display), signal type (BUY/SELL), entry price, dual targets (TGT 1, TGT 2), stop loss, and points change since signal generation. Color-coded headers instantly communicate market direction-green headers for BUY signals with positive momentum, red headers for SELL signals with negative momentum. The Pagination System organizes large watchlists (e.g., 232 symbols across 15 pages) with PREV/NEXT navigation and a symbol counter showing your current viewing range (e.g., "17-32 / 232 | Page 2 / 15").
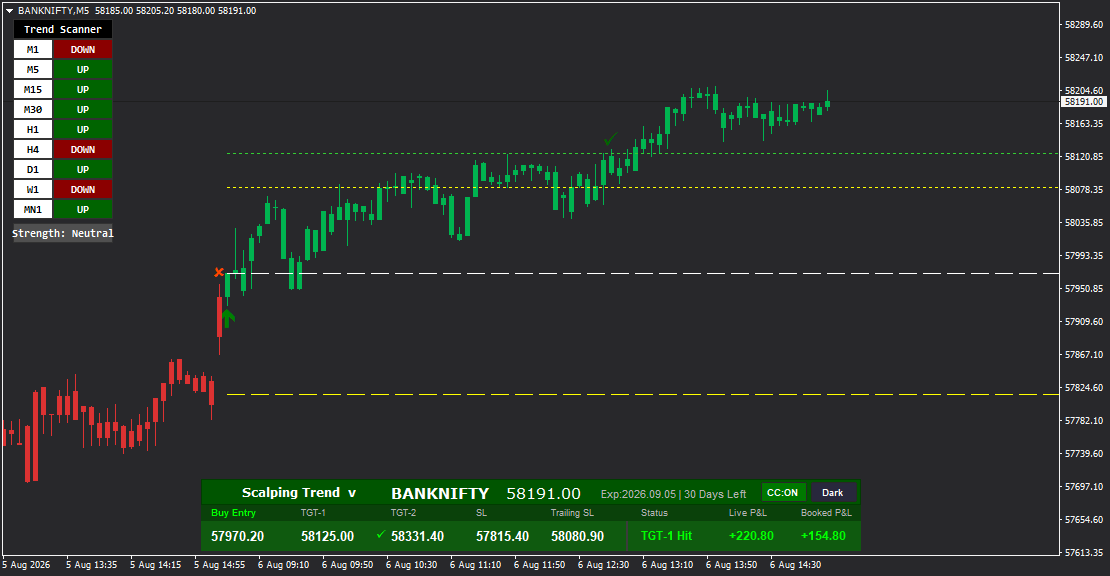
What sets Scalping Scanner apart is its integration with the Scalping Trend indicator. When you click any symbol card on the dashboard, the system opens a full chart view with Scalping Trend pre-loaded, featuring the powerful Trend Scanner panel on the left side of the chart. This panel analyzes 9 timeframes simultaneously-M1 (1-minute), M5 (5-minute), M15 (15-minute), M30 (30-minute), H1 (1-hour), H4 (4-hour), D1 (Daily), W1 (Weekly), and MN1 (Monthly)-displaying UP, DOWN, or neutral status for each period. The bottom of the panel shows an overall Strength Indicator (Neutral, Bullish, or Bearish), summarizing market sentiment across all timeframes.
This multi-timeframe confirmation is critical for scalping success. For example, you might see BANKNIFTY on the dashboard with a BUY signal and +220.80 pts. Click the card - chart opens with Scalping Trend - Trend Scanner shows M5 UP, M15 UP, M30 UP, H1 UP, D1 UP, confirming strong alignment - you execute the trade with confidence. Without multi-timeframe confirmation, you risk entering signals that conflict with higher timeframe trends, leading to false signals and losses.
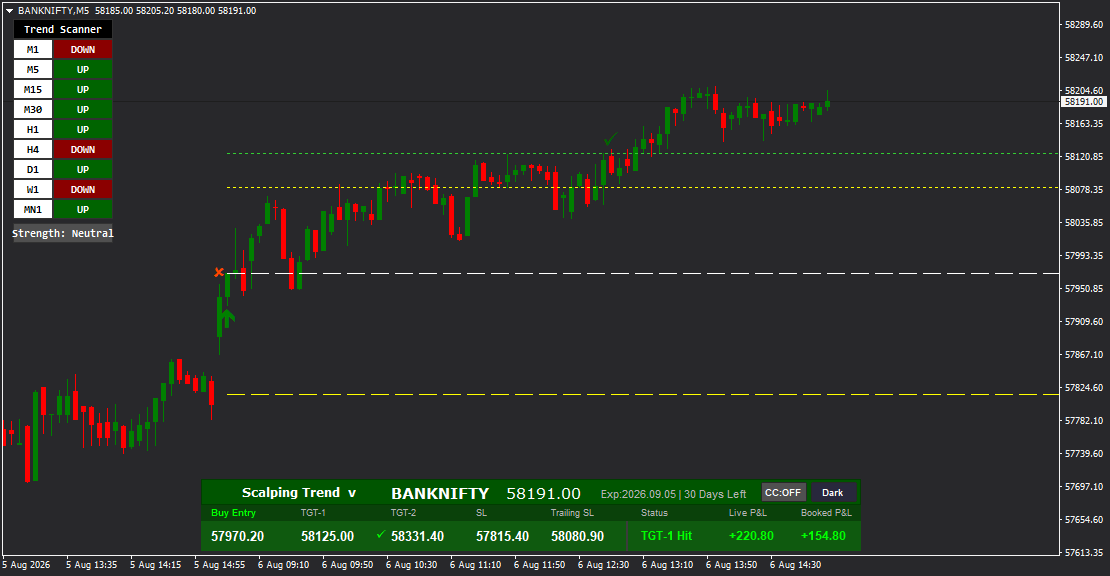
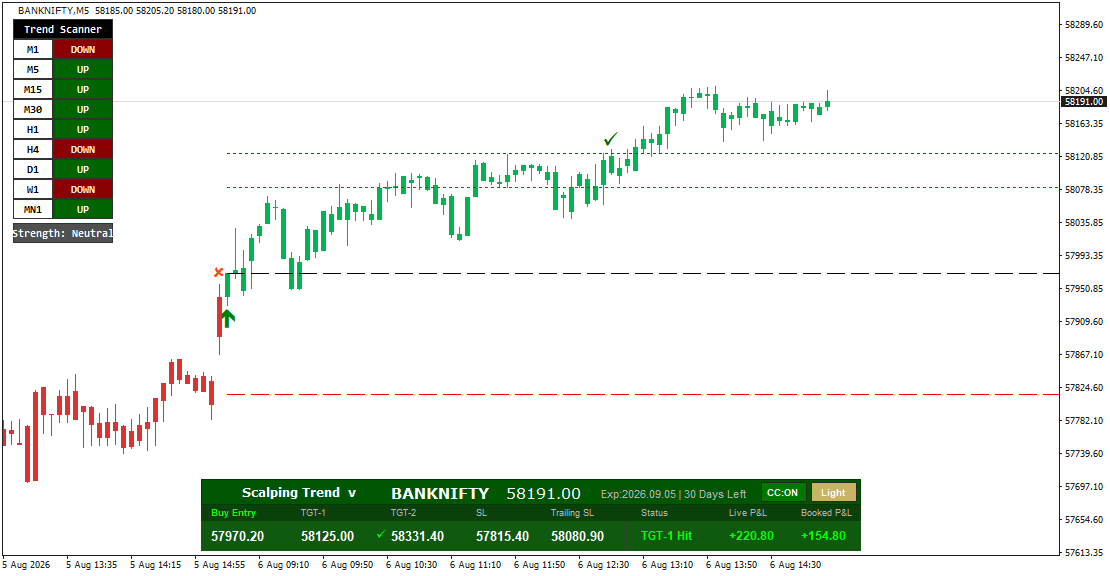
The chart view includes all Scalping Trend features: entry markers (red X for BUY, red arrow for SELL), horizontal dotted lines for entry/targets/stop loss, checkmark (-) confirmations when targets are achieved, a bottom dashboard showing trade parameters (Buy Entry, TGT-1, TGT-2, SL, Trailing SL, Status, Live P&L, Booked P&L), and display toggles (CC-ON/OFF for color-coded candles, Light/Dark theme).
Target Achievement Indicators on the dashboard cards show checkmarks (-) next to TGT 1 and TGT 2 when achieved, helping you quickly identify which trades are performing. The Points Change Display (e.g., "+220.80 pts", "-7.10 pts") shows price movement since signal generation, indicating momentum strength. The Light/Dark Theme toggle works across both dashboard and chart views, and the Expiry Tracker at the top monitors contract expiration for options/futures traders.
Scalping Scanner is designed for traders who need to maximize market coverage while maintaining analytical rigor. Instead of spending 30-60 minutes manually scanning charts and loading indicators, you scan 48+ symbols in 3-5 minutes via the dashboard, identify 3-5 strong candidates, click through to view Trend Scanner confirmations, and execute 2-3 high-probability trades in under 15 minutes total. This time efficiency, combined with multi-timeframe validation, significantly improves trade selection quality and overall profitability.
FEATURE HIGHLIGHTS
- Multi-Symbol Dashboard - Displays 16 symbols per page in organized 4x4 grid layout
- Scalping Trend Integration - Clicking symbol cards opens full chart with Scalping Trend indicator pre-loaded
- Trend Scanner Panel - 9-timeframe analysis (M1, M5, M15, M30, H1, H4, D1, W1, MN1) with UP/DOWN indicators
- Strength Indicator - Overall market sentiment (Neutral, Bullish, Bearish) summarizing timeframe alignment
- Pagination System - Navigate through multiple pages (e.g., Page 2 / 15) for 200+ symbols
- Symbol Counter - Shows current viewing range (e.g., "17-32 / 232")
- PREV / NEXT Navigation - Quick page switching for seamless browsing
- Clickable Symbol Cards - One-click access to detailed chart analysis with multi-timeframe confirmation
- Complete Trade Setups - Each card shows BUY/SELL, Entry, TGT 1, TGT 2, Stop Loss
- Current Price Display - Large prominent price for each symbol in real-time
- Points Change Tracker - Shows pts movement (positive or negative) since signal generation
- Color-Coded Headers - Green for BUY signals/positive moves, Red for SELL signals/negative moves
- Target Achievement Indicators - Checkmarks (-) appear when TGT 1 or TGT 2 is achieved
- Light/Dark Theme Toggle - Consistent theme across dashboard and chart views
- CC-ON/OFF Toggle - Enable/disable color-coded candle sections for trend visualization
- Expiry Tracker - Displays contract expiration date and days remaining (derivatives)
- Visual Entry Markers - Red X for BUY entries, red arrow for SELL entries on chart
- Horizontal Level Lines - Dotted lines marking entry, targets, stop loss (color-coded)
- Performance Tracking - Live P&L and Booked P&L visible in chart view
- Trailing Stop Loss - Adaptive profit protection displayed in chart dashboard
- Status Monitor - "TGT-1 Hit" and other real-time trade status updates
- Watchlist Integration - Automatically scans all symbols in MT4 Market Watch
- Multi-Timeframe Confirmation - Validate signals with 9 timeframes before execution
- Time-Saving Workflow - Scan - Click - Confirm - Trade in under 15 minutes
- Professional Scalping Tool - Combines broad scanning with deep analysis
RECOMMENDED APPROACH
Initial Setup:
1. Add all symbols you want to scan to your MT4 Market Watch window (indices, stocks, forex, commodities)
2. Attach Scalping Scanner indicator to any chart-the dashboard appears automatically
3. Dashboard displays 16 symbols per page with current signals
Dashboard Scanning Workflow:
Step 1: Scan Multiple Pages
- Start on Page 1, scan the 16 symbol cards for strong signals
- Look for:
- Green headers with high positive pts (e.g., +220.80 pts, +327.80 pts) = strong BUY momentum
- Red headers with high negative pts (e.g., -7.10 pts) = strong SELL momentum
- Checkmarks (-) on targets = signal is working, consider entry on pullback
- Click NEXT > to view Page 2, scan 16 more symbols
- Continue through pages to identify 5-10 candidates
- Total time: 3-5 minutes to scan 48-64 symbols
Step 2: Multi-Timeframe Confirmation
- Click on a promising symbol card (e.g., BANKNIFTY showing +220.80 pts with BUY)
- Chart opens with Scalping Trend indicator and Trend Scanner panel visible
- Review the Trend Scanner panel (left side):
- For BUY Signals: Look for multiple "UP" readings (especially M5, M15, M30, H1)
- For SELL Signals: Look for multiple "DOWN" readings
- Strength Indicator: Should show "Bullish" for BUY or "Bearish" for SELL (or at least "Neutral")
- High-Probability Setup: 6+ timeframes agree (e.g., M5 UP, M15 UP, M30 UP, H1 UP, D1 UP, MN1 UP)
- Marginal Setup: 4-5 timeframes agree, others neutral or conflicting
- Poor Setup: Timeframes conflict (e.g., M5 UP but H1 DOWN, H4 DOWN, D1 DOWN) = skip trade
Step 3: Chart Analysis
- Review the chart for visual confirmation:
- Entry marker (red X for BUY, red arrow for SELL) placement
- Horizontal target lines (TGT-1, TGT-2) showing profit potential
- Stop loss line showing risk exposure
- Recent price action (trending cleanly or choppy?)
- Check the bottom dashboard:
- Entry, TGT-1, TGT-2, SL, Trailing SL values
- Status field for any alerts ("TGT-1 Hit", etc.)
- Live P&L and Booked P&L (if signal already active)
Step 4: Trade Execution Decision
- Execute Trade If:
- - 6+ timeframes align with signal direction
- - Strength indicator confirms (Bullish for BUY, Bearish for SELL)
- - Points change shows strong momentum (+50+ pts for BUY, -50+ pts for SELL)
- - Risk-reward looks favorable (target distance > 2x stop loss distance)
- - Chart shows clean trend structure (not choppy consolidation)
- Skip Trade If:
- - 4+ timeframes conflict with signal direction
- - Strength indicator conflicts (Bearish for BUY signal, Bullish for SELL signal)
- - Points change is minimal (+2 to +10 pts) = weak momentum
- - Chart looks choppy or rangebound
Step 5: Return to Dashboard
- After executing trade or skipping, return to Scalping Scanner dashboard
- Click NEXT to continue scanning more pages
- Repeat Steps 2-4 for next candidate
- Target: Execute 2-3 high-probability trades per scanning session
Monitoring Active Positions:
- Use dashboard to monitor open trades
- Look for checkmarks (-) next to targets indicating TGT-1 or TGT-2 achievement
- Click symbol cards to view detailed chart updates
- Check Trailing SL status in chart dashboard
- Exit trades when TGT-2 is hit or Trailing SL is triggered
Theme and Display Settings:
- Light Theme: Use during daytime or for presentations
- Dark Theme: Use for extended sessions to reduce eye strain
- CC-ON: Enable color-coded candle sections for visual trend clarity
- CC-OFF: Disable for traditional candle coloring (individual red/green candles)
Recommended Timeframes for Scalping:
- Ultra-Fast Scalping: M1, M5 charts (30-second to 5-minute holds)
- Standard Scalping: M5, M15 charts (5-15 minute holds)
- Intraday Scalping: M15, M30 charts (15-30 minute holds)
Risk Management:
- Never trade without confirming multi-timeframe alignment
- Always place stop loss at the SL level provided
- Use Trailing SL once TGT-1 is achieved
- Reduce position size when Strength shows "Neutral" (mixed timeframes)
- Avoid trades when dashboard shows conflicting signals across a sector
Example Workflow:
Scenario: Morning Scalping Session
1. 9:15 AM - Market Open
- Open Scalping Scanner dashboard
- Scan Page 1 (16 symbols): Identify BANKNIFTY (+220.80 pts, BUY), AUBANK (+38.00 pts, BUY)
- Scan Page 2 (16 symbols): Identify BANKNIFTYn (+327.80 pts, BUY), BAJAJ-AUTO (+41.00 pts, SELL)
- Total scanning time: 3 minutes
2. 9:18 AM - Confirm BANKNIFTY
- Click BANKNIFTY card - Chart opens with Scalping Trend
- Trend Scanner shows: M1 DOWN, M5 UP, M15 UP, M30 UP, H1 UP, H4 DOWN, D1 UP, W1 DOWN, MN1 UP
- Count: 5 UP, 3 DOWN, 1 neutral - Moderate alignment
- Strength: Neutral
- Decision: Marginal setup due to mixed timeframes, reduce position size by 50%
3. 9:22 AM - Confirm BANKNIFTYn
- Click BANKNIFTYn card - Chart opens
- Trend Scanner shows: M5 UP, M15 UP, M30 UP, H1 UP, H4 DOWN, D1 UP, W1 DOWN, MN1 UP
- Count: 6 UP, 2 DOWN - Strong alignment
- Strength: Neutral (would prefer Bullish, but alignment is good)
- Decision: Execute full position size
4. 9:25 AM - Execute Trades
- Enter BANKNIFTYn BUY at 58307.80, SL 58074.20, TGT-1 58276.90, TGT-2 58336.50
- Enter BANKNIFTY BUY at 57970.20 (reduced size), SL 57732.50, TGT-1 58125.00, TGT-2 58331.40
5. 10:00 AM - Monitor Positions
- Open dashboard - Both cards show checkmarks on TGT-1
- Book 50% of each position, move stop to breakeven
- Return to scanning for new opportunities
6. 10:30 AM - TGT-2 Achieved
- Dashboard shows both positions with -- on TGT-2
- Exit remaining 50%, session complete
- Total session time: 75 minutes, 2 trades executed, both profitable
TREND SCANNER PANEL GUIDE
Understanding the Trend Scanner:
When you click a symbol card and the chart opens, the Trend Scanner panel appears on the left side of the chart. This panel is your multi-timeframe confirmation tool, analyzing 9 timeframes simultaneously to validate signal quality.
9 Timeframes Analyzed:
1. M1 (1-Minute): Ultra-short-term momentum (noise-prone, use for ultra-fast scalping only)
2. M5 (5-Minute): Short-term scalping trend (primary timeframe for fast scalping)
3. M15 (15-Minute): Intraday trend confirmation (key timeframe for standard scalping)
4. M30 (30-Minute): Medium-term intraday direction (strong confirmation layer)
5. H1 (1-Hour): Hourly trend bias (critical for swing context)
6. H4 (4-Hour): Swing trend context (filters against counter-trend scalps)
7. D1 (Daily): Primary trend direction (master trend filter)
8. W1 (Weekly): Long-term trend alignment (institutional bias)
9. MN1 (Monthly): Major trend backdrop (macro context)
Color Coding:
- Green "UP": Bullish trend on that timeframe
- Red "DOWN": Bearish trend on that timeframe
- Gray "-": Neutral or no clear trend
Strength Indicator:
Displayed at the bottom of the Trend Scanner panel:
- Strength: Bullish: Majority of timeframes trending UP (ideal for BUY signals)
- Strength: Bearish: Majority of timeframes trending DOWN (ideal for SELL signals)
- Strength: Neutral: Mixed timeframe signals (proceed with caution)
How to Use Trend Scanner for Signal Validation:
For BUY Signals:
Excellent Setup (Execute Full Position):
- 7-9 timeframes show "UP" (especially M5, M15, M30, H1, D1)
- Strength: Bullish
- Example: M5 UP, M15 UP, M30 UP, H1 UP, H4 UP, D1 UP, W1 UP - 7 UP
Good Setup (Execute Standard Position):
- 5-6 timeframes show "UP"
- Strength: Neutral or Bullish
- Key timeframes (M5, M15, M30) align as UP
- Example: M5 UP, M15 UP, M30 UP, H1 UP, D1 UP, but H4 DOWN, W1 DOWN - 5 UP
Marginal Setup (Reduce Position Size 50%):
- 4 timeframes show "UP"
- Strength: Neutral
- Some key timeframes conflict (e.g., H1 DOWN but M5 UP)
- Example: M5 UP, M15 UP, M30 UP, D1 UP, but H1 DOWN, H4 DOWN - 4 UP
Poor Setup (Skip Trade):
- 3 or fewer timeframes show "UP"
- Strength: Bearish (conflicts with BUY signal)
- Key timeframes DOWN (M15 DOWN, H1 DOWN, D1 DOWN)
- Example: M5 UP, M30 UP, but M15 DOWN, H1 DOWN, H4 DOWN, D1 DOWN - 2 UP
For SELL Signals:
Apply the same logic in reverse:
- Excellent: 7-9 timeframes "DOWN", Strength: Bearish
- Good: 5-6 timeframes "DOWN", Strength: Neutral or Bearish
- Marginal: 4 timeframes "DOWN", Strength: Neutral
- Poor: 3 or fewer timeframes "DOWN", Strength: Bullish (conflict)
Timeframe Priority for Scalpers:
Not all timeframes carry equal weight. Focus on these:
Critical (Must Align):
- M5, M15, M30 - These are your primary scalping timeframes; if they conflict, skip the trade
Important (Should Align):
- H1, D1 - Provide trend context; 1-2 conflicts acceptable if critical timeframes align
Context (Nice to Have):
- H4, W1, MN1 - Provide macro context; conflicts here less critical for scalping
Low Priority (Often Ignore):
- M1 - Too noisy; only relevant for ultra-fast scalping (<1 minute holds)
Example Analysis:
Screenshot 1 (BANKNIFTY BUY Signal):
- M1: DOWN (ignore, too noisy)
- M5: UP - (critical)
- M15: UP - (critical)
- M30: UP - (critical)
- H1: UP - (important)
- H4: DOWN - (important conflict)
- D1: UP - (important)
- W1: DOWN - (context conflict)
- MN1: UP - (context)
- Assessment: 6 UP, 3 DOWN - Good setup
- Critical timeframes: M5 UP, M15 UP, M30 UP - All aligned -
- Strength: Neutral
- Decision: Execute standard position size (not full due to H4/W1 conflicts)
Practical Tips:
1. Quick Visual Scan: Look at M5, M15, M30 first-if all green, signal is strong
2. Count Method: Count UP vs. DOWN; if 6+ align, proceed
3. Critical Conflicts: If M15 or M30 conflicts with signal direction, skip trade
4. Strength Override: If Strength shows Bearish but you have a BUY signal, skip-too risky
5. Neutral Strength: Acceptable if 5+ timeframes align; just reduce position size slightly
DASHBOARD VS. CHART WORKFLOW
Dashboard View (Scanning Mode):
Purpose: Broad market scanning to identify opportunities
What You See:
- 16 symbol cards per page in 4x4 grid
- Symbol name, current price, points change
- BUY/SELL signal type
- Entry, TGT 1, TGT 2, Stop Loss values
- Target achievement checkmarks (-)
- Color-coded headers (green for BUY, red for SELL)
What You Do:
- Scan cards for strong signals (high points change, checkmarks visible)
- Navigate pages with PREV/NEXT buttons
- Identify 5-10 candidate trades
- Click promising symbol cards to view detailed charts
Time Spent: 3-5 minutes per 48-64 symbols
Chart View (Confirmation Mode):
Purpose: Multi-timeframe validation and trade execution
What You See:
- Full price chart with candlesticks
- Trend Scanner panel (left side): 9 timeframes with UP/DOWN/neutral, Strength indicator
- Entry markers (red X for BUY, red arrow for SELL)
- Horizontal dotted lines for entry, targets, stop loss (color-coded)
- Bottom dashboard: Buy Entry, TGT-1, TGT-2, SL, Trailing SL, Status, Live P&L, Booked P&L
- Display toggles: CC-ON/OFF, Light/Dark theme
- Expiry tracker
What You Do:
- Review Trend Scanner panel for multi-timeframe alignment
- Count UP vs. DOWN timeframes
- Check Strength indicator (Bullish/Bearish/Neutral)
- Validate chart structure (trending vs. choppy)
- Confirm risk-reward is favorable
- Execute trade if all criteria met
Time Spent: 1-2 minutes per symbol for confirmation
Combined Workflow:
1. Dashboard: Scan 16 symbols - Identify 3 candidates - 2 minutes
2. Chart (Candidate 1): Multi-timeframe check - Poor alignment - Skip - 1 minute
3. Chart (Candidate 2): Multi-timeframe check - Good alignment - Execute - 2 minutes
4. Chart (Candidate 3): Multi-timeframe check - Excellent alignment - Execute - 2 minutes
5. Return to Dashboard: Scan next page for more opportunities - 2 minutes
Total Time: 9 minutes to scan 16 symbols and execute 2 high-probability trades
Without Scalping Scanner: 30-45 minutes to manually scan 16 charts, load indicators, analyze timeframes
Time Saved: 70-80% reduction in analysis time
VISUAL ELEMENTS GUIDE
Dashboard Elements:
Top Bar:
- LIGHT / DARK Toggle: Switch dashboard background (left side)
- Title: "Scalping Scanner" (center)
- Symbol Counter: "17-32 / 232 | Page 2 / 15" (center-right)
- Navigation: "< PREV" and "NEXT >" buttons (right)
- Expiry Tracker: "Expiry: 2026.09.05 (30 days left)" (far right)
Symbol Cards:
- Header: Symbol name (e.g., "BANKNIFTY") + points change (e.g., "+220.80 pts")
- Green header = BUY signal / positive movement
- Red header = SELL signal / negative movement
- Center: Large current price (e.g., "58191.00")
- Left Column: BUY/SELL button + Entry price + S/L value
- Right Column: TGT 1 value + TGT 2 value (with - checkmarks if achieved)
Chart Elements:
Trend Scanner Panel (Left Side):
- Title: "Trend Scanner"
- 9 rows: M1, M5, M15, M30, H1, H4, D1, W1, MN1
- Each row shows: Timeframe label + Status button (UP/DOWN/-)
- Green "UP" button = bullish
- Red "DOWN" button = bearish
- Gray "-" = neutral
- Bottom: "Strength: Neutral/Bullish/Bearish"
Chart Canvas:
- Entry Marker: Red X (BUY) or red arrow pointing down (SELL)
- Horizontal Lines: Dotted lines for entry, targets, stop loss
- White dashed lines (entry, targets, stop loss)
- Yellow dashed line (visible in some screenshots, additional level)
- Checkmarks: - symbol on chart when targets achieved
- Candles: Color-coded when CC-ON (solid trend sections), traditional when CC-OFF
Bottom Dashboard:
- Title Bar: "Scalping Trend -" + Symbol name + Current price + Expiry + Days left + CC-ON/OFF + Theme toggle
- Parameters Row:
- Buy Entry / Sell Entry: Entry price
- TGT-1: First target price (with - if achieved)
- TGT-2: Second target price (with - if achieved)
- SL: Stop loss price
- Trailing SL: Adaptive stop loss price
- Status: "TGT-1 Hit" or "ACTIVE" etc.
- Live P&L: Real-time profit/loss (green positive, red negative)
- Booked P&L: Realized profit
Color Themes:
- Light Theme: White/light gray dashboard background, light gray chart background
- Dark Theme: Dark gray/black dashboard background, black chart background
Candle Display Modes:
- CC-ON: Solid color sections (green for uptrend, red for downtrend)
- CC-OFF: Traditional individual candle colors (green candle = close > open, red candle = close < open)
TECHNICAL SPECIFICATIONS
Indicator Type: Multi-symbol scanning dashboard with integrated Scalping Trend indicator and 9-timeframe analysis
Scan Capacity: 200+ symbols (232+ shown in example)
Display Format: 16 symbols per page in 4x4 grid layout
Pagination: PREV/NEXT navigation with page counter (e.g., "Page 2 / 15")
Signal Types: BUY and SELL with dual targets
Integration: Clickable cards open full charts with Scalping Trend indicator pre-loaded
Trend Scanner: 9 timeframes (M1, M5, M15, M30, H1, H4, D1, W1, MN1) with UP/DOWN/neutral indicators
Strength Indicator: Overall market sentiment (Neutral, Bullish, Bearish)
Card Elements: Symbol name, current price, points change, entry, TGT 1, TGT 2, stop loss
Color Coding: Green headers (BUY/positive), Red headers (SELL/negative)
Target Indicators: Checkmarks (-) for achieved targets
Theme Options: Light and Dark background toggle (dashboard and chart)
Candle Display: CC-ON (color-coded sections) and CC-OFF (traditional candles)
Stop Loss System: Fixed SL + Adaptive Trailing SL
Performance Tracking: Real-time Live P&L and Booked P&L in chart view
Expiry Tracking: Contract expiration date and days remaining display
Visual Aids: Entry markers (X/arrow), horizontal level lines, checkmarks, Trend Scanner panel
Watchlist Source: Automatically scans all symbols in MT4 Market Watch window
Real-Time Updates: Dashboard and charts refresh continuously
Market Coverage: Indices, stocks, forex, commodities, options, futures
Platform: MetaTrader 4 (MT4).