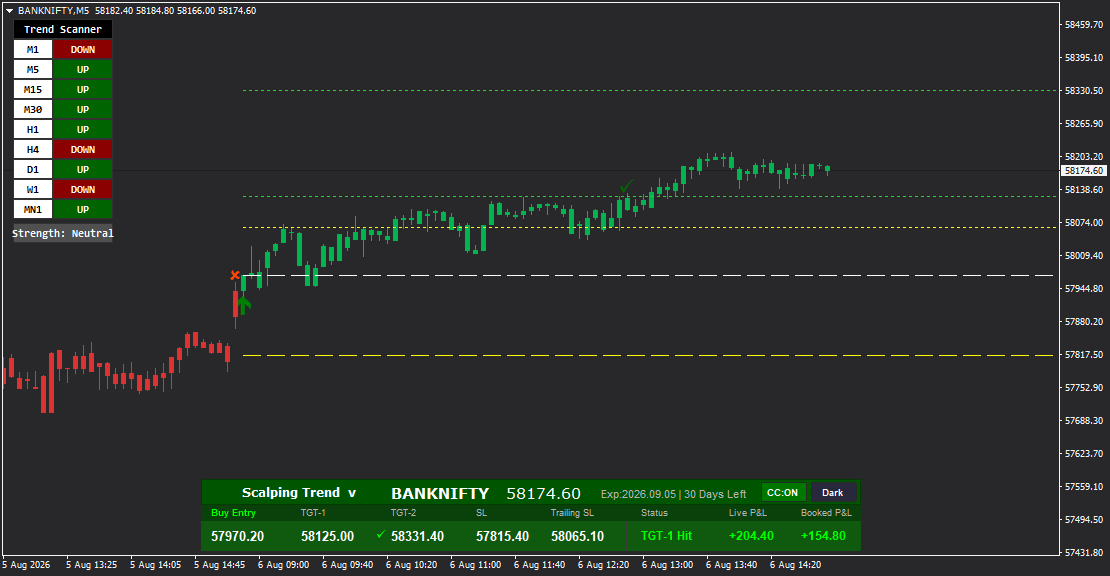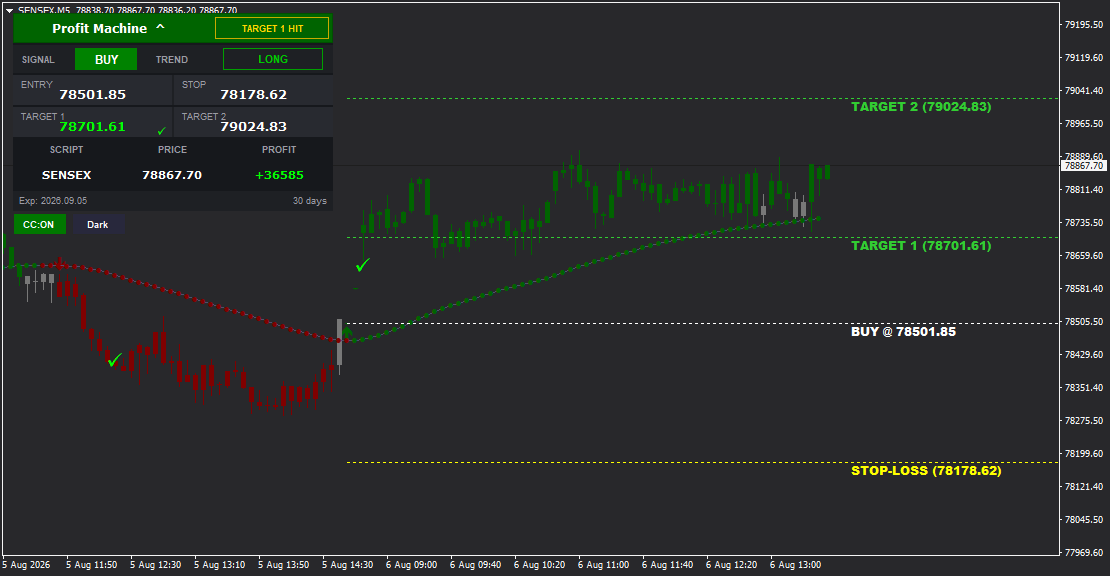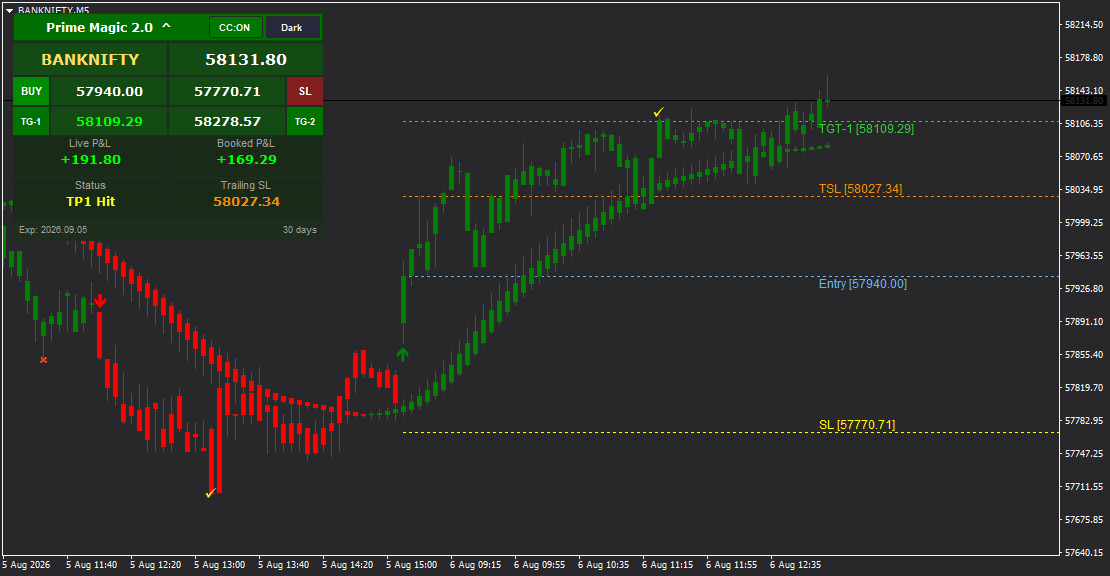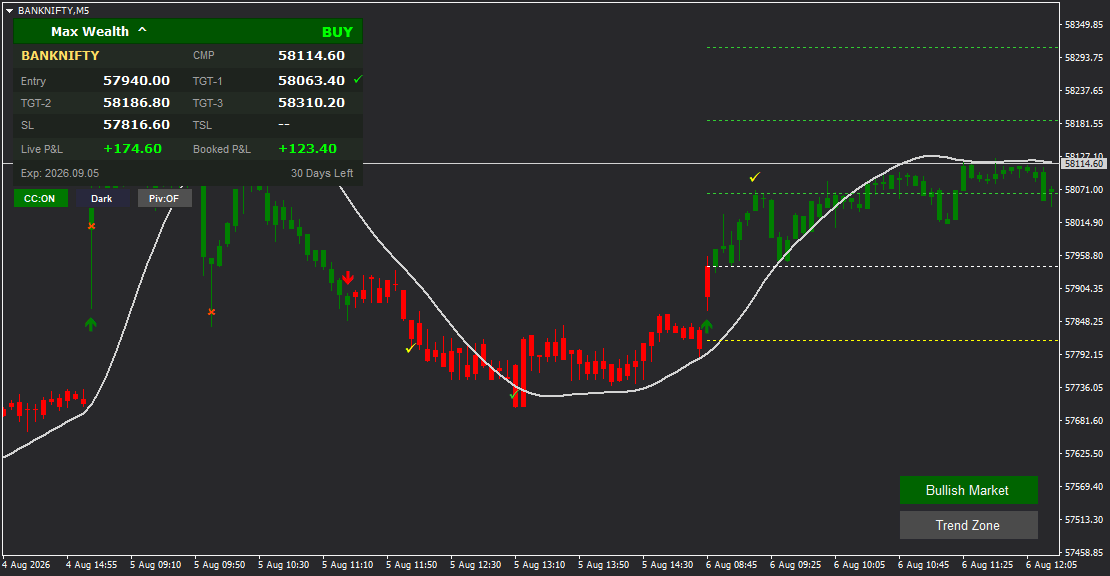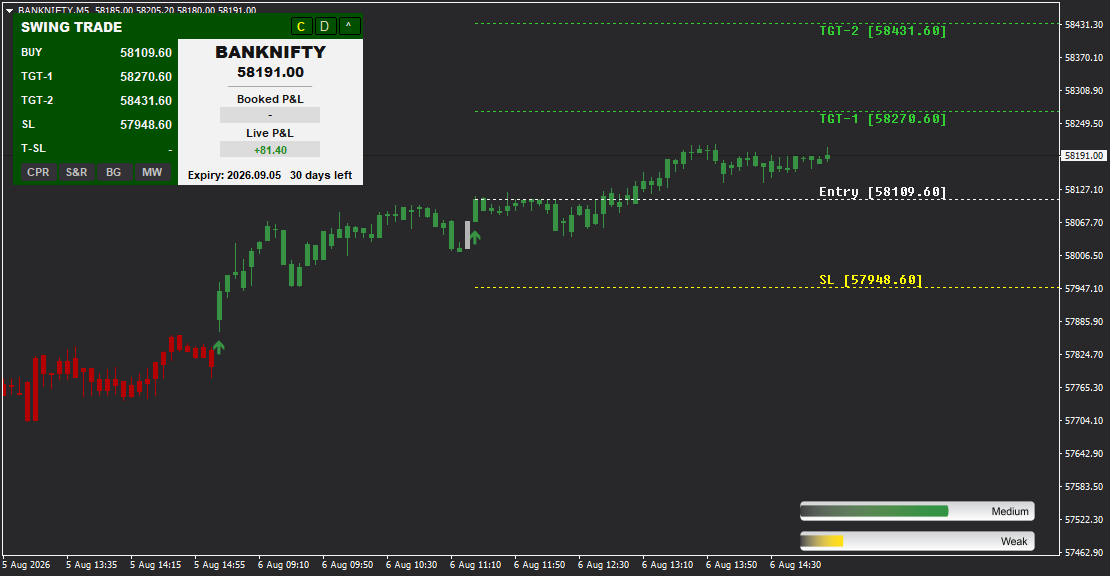

Master swing trading with confidence using Swing Trade-the all-in-one indicator designed for multi-day position traders who need comprehensive market analysis at their fingertips. Featuring four powerful interactive toggle buttons (CPR, S&R, BG, MW), this indicator transforms your trading experience by providing instant access to Central Pivot Range analysis, Support & Resistance levels, visual Background zones, and a quick Market Watch switcher for seamless multi-symbol monitoring. Whether you're trading indices, stocks, or commodities, Swing Trade delivers precise BUY/SELL signals with dual targets (TGT-1, TGT-2), adaptive Trailing Stop Loss, and real-time MT4 Data Feed P&L tracking. The CPR toggle reveals Top Central, Central Pivot, and Bottom Central levels for day trading pivots. The S&R button instantly displays critical support and resistance zones. The BG feature paints color-coded zones across your chart (green for targets, gray for entry, black for stop loss) for visual trade planning. The MW (Market Watch) button opens a symbol panel with 10+ instruments for instant chart switching without leaving the indicator. Perfect for swing traders who hold positions for days or weeks and need professional-grade tools to maximize profit potential while managing risk effectively.
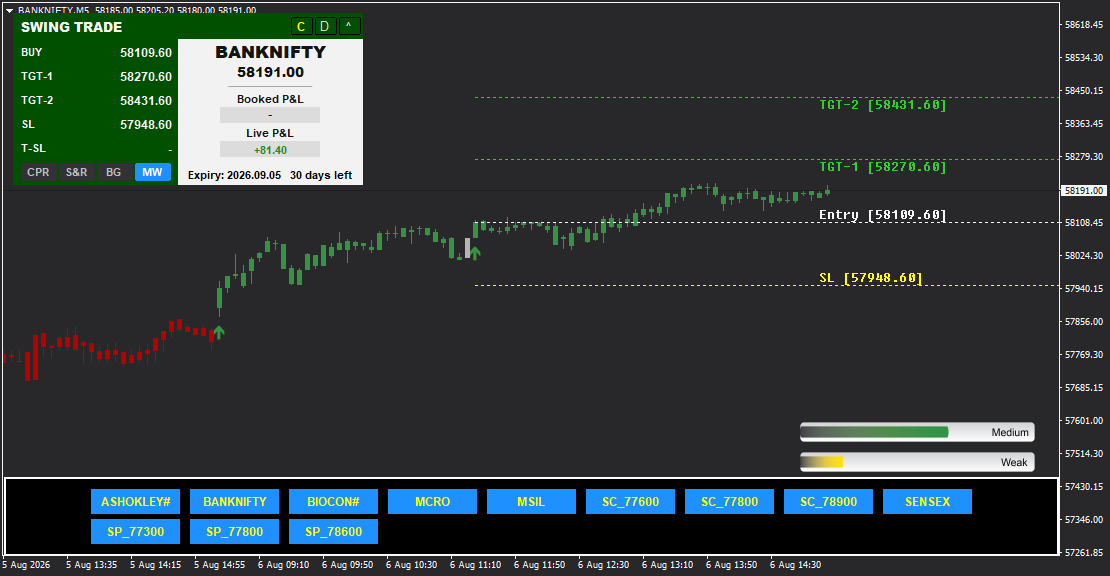
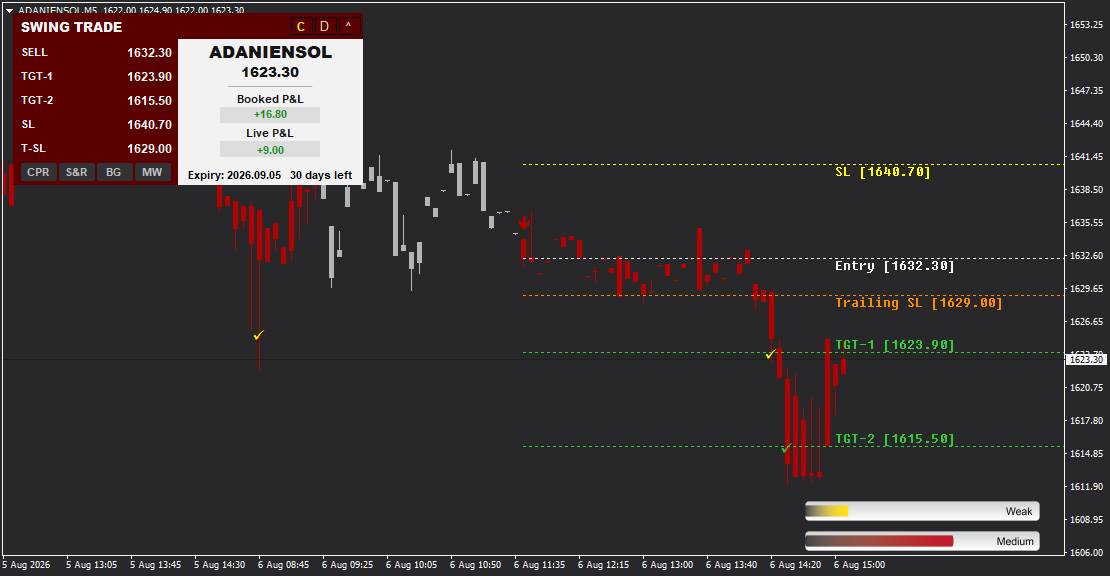
Swing Trade is built for position traders who hold trades across multiple sessions and need comprehensive market intelligence without cluttering their charts. At the heart of this indicator are four interactive toggle buttons that transform your trading workspace with a single click-providing instant access to pivot analysis, support/resistance zones, visual trade planning, and works with MT4 Data Feed across multi-symbol monitoring.
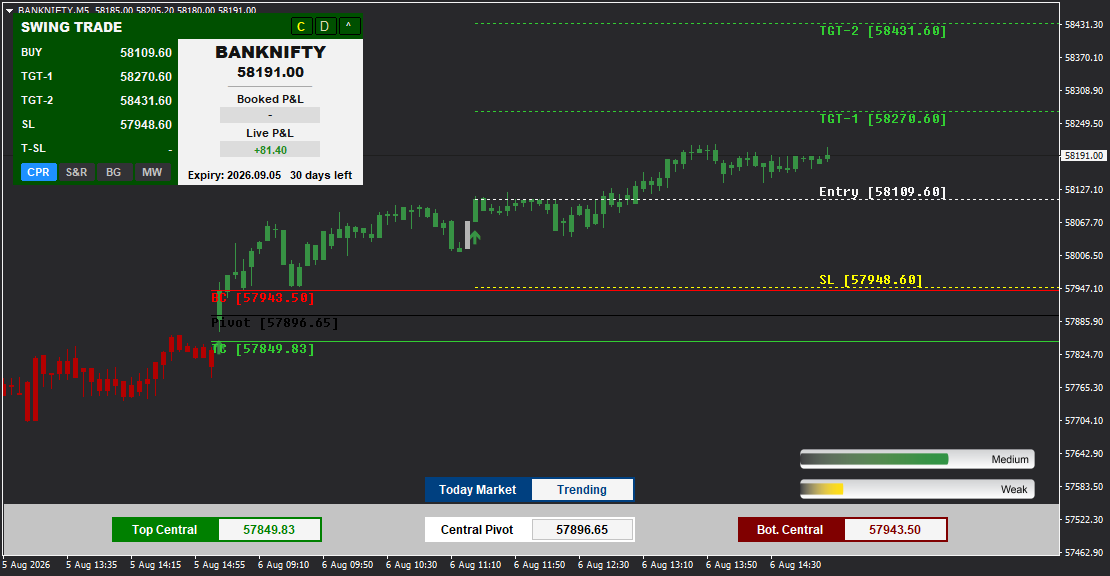
The CPR (Central Pivot Range) toggle displays three critical pivot levels: Top Central, Central Pivot, and Bottom Central. These levels are essential for day and swing traders to identify intraday breakout zones, reversal areas, and trend continuation patterns. When CPR is active, horizontal lines appear on your chart with exact price values, plus a convenient bottom panel showing all three levels in organized boxes (Today Market/Trending tabs).
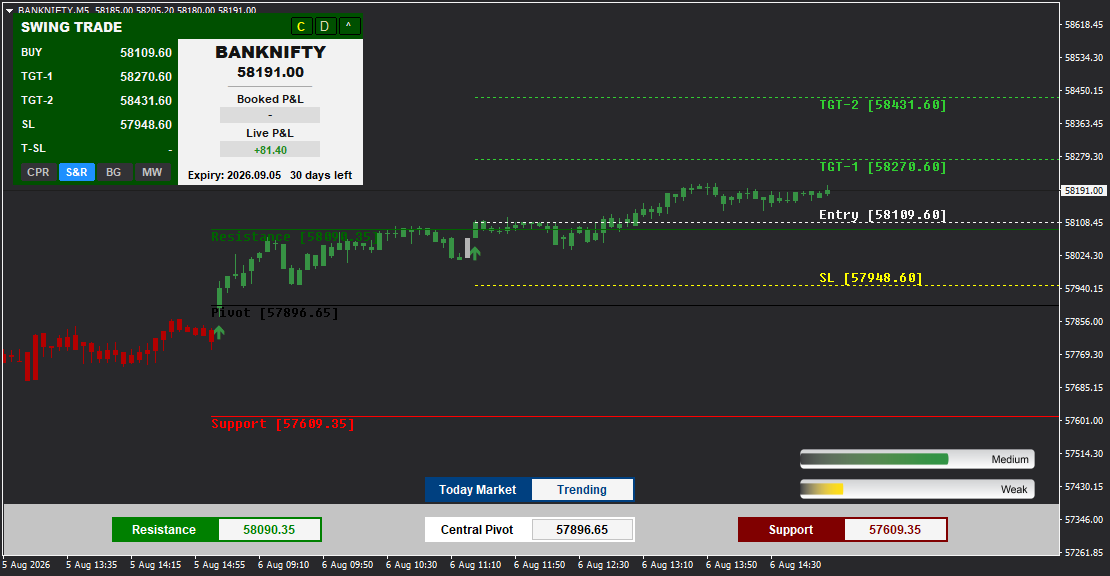
The S&R (Support & Resistance) toggle reveals key support and resistance levels calculated from recent price structure. When activated, you see Resistance, Central Pivot, and Support lines plotted on your chart with color-coded labels (green for resistance, red for support). The bottom panel provides precise numerical values in three distinct boxes, helping you plan entries near support and exits near resistance.
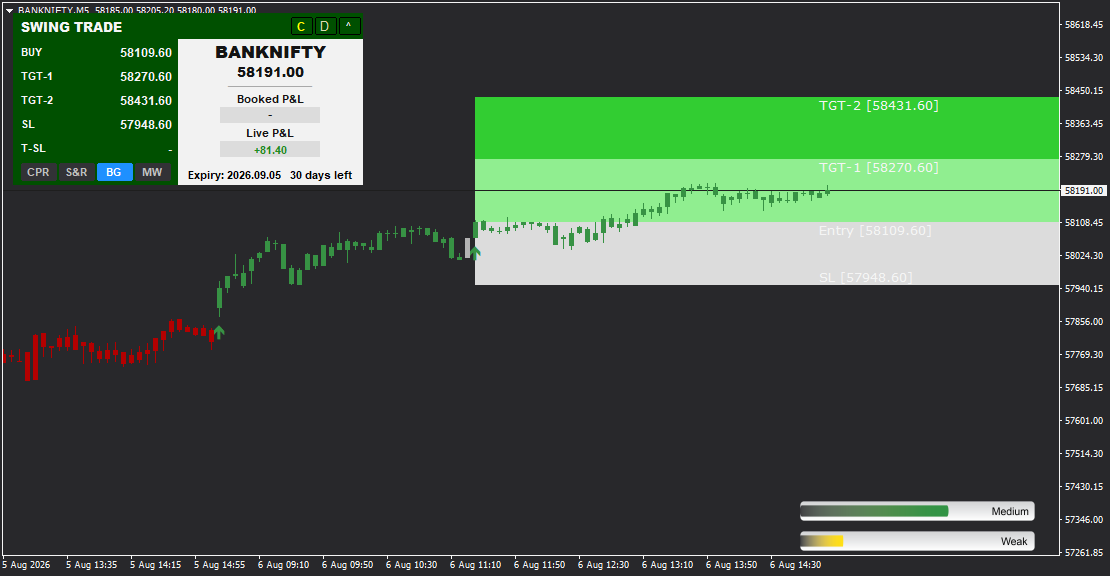
The BG (Background) toggle is a visual game-changer for swing traders. It paints color-coded zones across your chart-green zones for TGT-1 and TGT-2 areas (profit zones), gray zone for Entry level (entry zone), and black zone below Stop Loss (danger zone). This visual representation makes trade planning intuitive: you can instantly see how much profit potential exists versus risk exposure.
The MW (Market Watch) toggle opens a bottom panel displaying 10+ symbols as clickable blue buttons (BANKNIFTY, SENSEX, ASHOKLEY#, BIOCON#, MCRO, MSIL, SC_77600, SP_77000, etc.). Click any symbol to instantly switch charts without manually searching-perfect for swing traders monitoring multiple positions across different instruments or sectors.
Beyond these powerful toggles, Swing Trade provides complete trade setups with BUY/SELL entry prices, dual targets (TGT-1 and TGT-2), fixed Stop Loss, and an intelligent Trailing Stop Loss (T-SL) that activates after TGT-1 is achieved, protecting your profits as the market moves favorably. The Strength Indicators (horizontal bars at bottom right) show "Weak" or "Medium" trend strength, helping you gauge momentum. Live P&L tracks unrealized profits in real-time, while Booked P&L shows realized gains. The Expiry Tracker displays contract expiration dates and remaining days-critical for options and futures swing traders.
Visual clarity is enhanced with checkmark (-) confirmations when targets are hit, labeled price levels on the chart (Entry, TGT-1, TGT-2, SL, T-SL), and white dotted horizontal lines marking key levels. With red candles for SELL trades and green candles for BUY trades, Swing Trade provides a professional, organized trading environment optimized for multi-day position management.
---
## FEATURE HIGHLIGHTS
- Four Interactive Toggle Buttons - CPR, S&R, BG, MW for instant market analysis and multi-symbol monitoring
- CPR (Central Pivot Range) - Displays Top Central, Central Pivot, Bot. Central levels for pivot-based trading
- S&R (Support & Resistance) - Shows key support and resistance zones with color-coded labels
- BG (Background Zones) - Visual color-coded zones (green targets, gray entry, black stop) for intuitive planning
- MW (Market Watch) - Quick symbol switcher panel with 10+ instruments (BANKNIFTY, SENSEX, MCRO, etc.) for instant chart switching
- Dual Target System - TGT-1 and TGT-2 for progressive profit booking on swing trades
- Adaptive Trailing Stop Loss - T-SL protects profits after TGT-1, following price as market moves favorably
- Complete Trade Setup - Entry, Stop Loss, Trailing SL, and two targets on every signal
- Strength Indicators - Horizontal bars showing "Weak" and "Medium" trend strength for momentum assessment
- Real-Time Performance Tracking - Live P&L (unrealized) and Booked P&L (realized) with color coding
- Expiry Tracker - Displays contract expiration date and days remaining (essential for derivatives swing trading)
- Visual Price Labels - All key levels (Entry, TGT-1, TGT-2, SL, T-SL) labeled directly on chart
- Checkmark Confirmations - - symbol appears when targets are achieved
- Dotted Level Lines - Horizontal white dashed lines marking entry, stop, and target levels
- Pivot Panel Display - Bottom panel shows CPR/S&R values in organized boxes when toggles are active
- Multi-Symbol Capability - Monitor and switch between multiple instruments without leaving the indicator
- Swing Trading Optimized - Designed specifically for multi-day and multi-week position traders
- One-Chart Solution - All analysis tools (pivots, S&R, zones, watchlist) integrated in one indicator
- Suitable for All Markets - Works on indices, stocks, forex, commodities, options, and futures
RECOMMENDED APPROACH
Initial Setup:
1. Attach Swing Trade indicator to your preferred swing trading chart (daily, 4-hour, or hourly)
2. Wait for clear BUY or SELL signal with complete trade parameters
3. Review the four toggle buttons to access additional analysis tools as needed
Trade Execution Strategy:
- For BUY Signals: Enter at the specified Buy Entry price, place stop at SL level
- For SELL Signals: Enter at the specified Sell Entry price, place stop at SL level
- Book 50% position at TGT-1 (first target)
- Move stop to breakeven or activate Trailing SL after TGT-1 is hit
- Hold remaining 50% for TGT-2 or trail stop until T-SL exits the trade
Using the Four Toggle Buttons:
CPR Toggle (Central Pivot Range):
- Activate CPR to see Top Central, Central Pivot, and Bot. Central levels
- Price above Top Central = bullish bias (look for BUY signals)
- Price below Bot. Central = bearish bias (look for SELL signals)
- Price near Central Pivot = neutral zone (wait for breakout confirmation)
- Use CPR levels as additional confirmation for signal entries
S&R Toggle (Support & Resistance):
- Activate S&R to see key support and resistance levels
- Enter BUY signals near Support levels (higher probability of bounce)
- Enter SELL signals near Resistance levels (higher probability of reversal)
- Avoid trades in the middle zone between support and resistance
- Use S&R levels to set realistic profit targets beyond TGT-2
BG Toggle (Background Zones):
- Activate BG to visualize risk-reward zones on your chart
- Green zones = profit potential areas (TGT-1 and TGT-2)
- Gray zone = entry area (neutral risk zone)
- Black zone = stop loss area (risk zone below entry)
- Visually assess if profit potential (green area size) justifies risk (distance to black zone)
- Ideal swing trades show large green zones relative to gray-to-black distance (3:1 or better risk-reward)
MW Toggle (Market Watch):
- Activate MW to see all available symbols in bottom panel
- Click any symbol button (BANKNIFTY, SENSEX, MCRO, etc.) to switch charts instantly
- Monitor multiple swing positions across different instruments without manual symbol search
- Quickly scan watchlist for new signal opportunities
- Save time by avoiding repetitive symbol selection through MT4 menus
Swing Trading Checklist:
- - Signal direction (BUY or SELL) aligns with higher timeframe trend
- - CPR shows favorable pivot positioning (above Top Central for BUY, below Bot. This leverages MT4 Data Feed for optimal performance. Central for SELL)
- - S&R confirms entry near support (BUY) or resistance (SELL)
- - BG visualization shows favorable risk-reward (large green zones)
- - Strength indicator shows "Medium" (avoid "Weak" signals when possible)
- - Entry, SL, TGT-1, TGT-2 all clearly defined
Recommended Timeframes:
- Swing Trading: Daily (D1), 4-Hour (H4) - Hold for days to weeks
- Position Trading: Weekly (W1) - Hold for weeks to months
- Aggressive Swing: 1-Hour (H1) - Hold for 1-3 days
Performance Monitoring:
- Monitor Live P&L to gauge unrealized profit/loss on open positions
- Track Booked P&L to measure cumulative realized profits across trades
- Watch Strength bars for trend momentum changes (Weak - Medium suggests strengthening trend)
- For derivatives, check Expiry Tracker regularly to avoid last-week positions (theta decay risk)
Risk Management:
- Never ignore the Stop Loss level, even on "high-confidence" signals
- Use Trailing SL feature once TGT-1 is achieved to protect profits
- Reduce position size when Strength shows "Weak" or when CPR/S&R conflict with signal direction
- For swing trades, allow 2-5 days for targets to develop (don't exit prematurely)
CPR (CENTRAL PIVOT RANGE) MASTERY GUIDE
What is CPR?
Central Pivot Range (CPR) is a powerful technical tool that identifies three key pivot levels for intraday and swing trading. These levels act as magnets for price action and help determine market bias.
Three CPR Levels Explained:
1. Top Central (TC): Upper boundary of the pivot range
- Price above TC = strong bullish bias
- Acts as support once broken upward
- Ideal zone for SELL signal resistance confirmation
2. Central Pivot (CP): Middle pivot point
- Acts as neutral equilibrium level
- Price oscillates around CP in ranging markets
- Breakout above/below CP signals trend direction
3. Bottom Central (BC): Lower boundary of the pivot range
- Price below BC = strong bearish bias
- Acts as resistance once broken downward
- Ideal zone for BUY signal support confirmation
How to Use CPR with Swing Trade Signals:
For BUY Signals:
- Best Case: Price near or above BC, signal appears - high probability bounce
- Strong Case: Price consolidates near CP, then breaks above TC with BUY signal
- Caution: BUY signal appears far above TC - late entry, reduce position size
For SELL Signals:
- Best Case: Price near or below TC, signal appears - high probability decline
- Strong Case: Price consolidates near CP, then breaks below BC with SELL signal
- Caution: SELL signal appears far below BC - late entry, reduce position size
CPR Width Analysis:
- Narrow CPR (TC and BC close together): Indicates potential trending day, expect strong directional move
- Wide CPR (TC and BC far apart): Indicates potential ranging day, expect consolidation
CPR Bottom Panel:
When CPR toggle is active, the bottom panel displays:
- Today Market Tab: Shows current day's CPR levels
- Trending Tab: Additional trend information
- Three Boxes: Top Central, Central Pivot, Bot. Central with exact numerical values
Example Scenarios:
- Screenshot shows BANKNIFTY BUY at 58109.60, with TC = 57849.83, CP = 57896.65, BC = 57943.50
- Entry is well above TC (58109 vs 57849), confirming strong bullish positioning
- CP and BC act as support zones if price retraces
S&R (SUPPORT & RESISTANCE) MASTERY GUIDE
What is S&R?
The S&R toggle reveals key support and resistance levels calculated from recent price structure, helping you identify high-probability entry zones and profit-taking levels.
Three S&R Levels Displayed:
1. Resistance: Upper boundary where selling pressure typically emerges
- Price approaching Resistance = potential reversal zone (good for SELL signals)
- Price breaking above Resistance = bullish breakout (target for BUY trades)
- Color-coded GREEN on chart and in bottom panel
2. Central Pivot: Middle reference point (often same as CPR Central Pivot)
- Acts as equilibrium level between support and resistance
- Price oscillates around Central Pivot in balanced markets
- Color-coded GRAY in bottom panel
3. Support: Lower boundary where buying pressure typically emerges
- Price approaching Support = potential bounce zone (good for BUY signals)
- Price breaking below Support = bearish breakdown (target for SELL trades)
- Color-coded RED on chart and in bottom panel
How to Use S&R with Swing Trade Signals:
For BUY Signals:
- Ideal Entry: BUY signal appears near Support level (price has bounced from support)
- Target Planning: TGT-1 should be near Central Pivot, TGT-2 near or above Resistance
- Confirmation: If BUY entry price is within 10-20 points of Support, signal reliability increases
- Stop Loss Validation: SL should be placed below Support to avoid premature exit from false breaks
For SELL Signals:
- Ideal Entry: SELL signal appears near Resistance level (price has rejected resistance)
- Target Planning: TGT-1 should be near Central Pivot, TGT-2 near or below Support
- Confirmation: If SELL entry price is within 10-20 points of Resistance, signal reliability increases
- Stop Loss Validation: SL should be placed above Resistance to avoid premature exit from false breaks
S&R Bottom Panel:
When S&R toggle is active, the bottom panel displays three boxes:
- Resistance Box (Green): Shows exact resistance price level
- Central Pivot Box (Gray): Shows exact central pivot price level
- Support Box (Red): Shows exact support price level
Swing Trading Strategies with S&R:
1. Support Bounce Strategy:
- Wait for price to approach Support level
- When BUY signal appears near Support, enter with confidence
- Use Support as initial stop loss reference (place SL 20-30 points below Support)
- Target Resistance for TGT-2 exits
2. Resistance Rejection Strategy:
- Wait for price to approach Resistance level
- When SELL signal appears near Resistance, enter with confidence
- Use Resistance as initial stop loss reference (place SL 20-30 points above Resistance)
- Target Support for TGT-2 exits
3. Breakout Confirmation Strategy:
- If price breaks above Resistance with strength, wait for BUY signal on retest
- If price breaks below Support with strength, wait for SELL signal on retest
- Broken resistance becomes new support; broken support becomes new resistance
Example Scenarios:
- Screenshot shows BANKNIFTY with Resistance = 58090.35, CP = 57896.65, Support = 57609.35
- BUY entry at 58109.60 is above Resistance, confirming bullish breakout
- TGT-2 at 58431.60 extends well beyond Resistance, targeting next resistance zone
BG (BACKGROUND ZONES) VISUALIZATION GUIDE
What is BG?
The BG (Background) toggle transforms your chart into a visual risk-reward map by painting color-coded zones that correspond to your trade setup-making swing trade planning intuitive and instantly understandable.
Four Color Zones Explained:
1. Green Zone (Top): TGT-2 area
- Represents maximum profit potential zone
- Extends from TGT-2 level to top of chart
- Goal: Price should reach this zone for full profit realization
2. Light Green Zone (Middle-Upper): TGT-1 area
- Represents first profit-taking zone
- Extends from TGT-1 to TGT-2
- Goal: Book 50% position when price reaches this zone
3. Gray Zone (Middle): Entry area
- Represents neutral risk zone where trade is initiated
- Extends from Entry level to TGT-1
- Current status: Trade active, waiting for profit development
4. Black Zone (Bottom): Stop Loss area
- Represents risk/danger zone below entry
- Extends from SL level downward
- Warning: Price should NOT enter this zone (stop out if breached)
How to Use BG for Trade Planning:
Visual Risk-Reward Assessment:
Before entering a trade, activate BG toggle and visually compare zone sizes:
- Excellent Trade: Green zones (TGT-1 + TGT-2 areas) are 3-5x larger than gray-to-black distance
- Example: Gray zone = 50 points, combined green zones = 200+ points (4:1 reward-risk)
- Proceed with full position size
- Good Trade: Green zones are 2-3x larger than gray-to-black distance
- Example: Gray zone = 100 points, combined green zones = 250 points (2.5:1 reward-risk)
- Proceed with standard position size
- Marginal Trade: Green zones are only 1-2x larger than gray-to-black distance
- Example: Gray zone = 150 points, combined green zones = 200 points (1.3:1 reward-risk)
- Reduce position size or skip trade
Visual Trade Monitoring:
After entering a trade with BG active:
- Price in Gray Zone: Trade just initiated, no profit yet (wait patiently)
- Price Approaching Light Green Zone: TGT-1 near, prepare to book 50% position
- Price in Light Green Zone: TGT-1 achieved (- appears), book 50%, move stop to breakeven
- Price Approaching Top Green Zone: TGT-2 near, prepare to book remaining 50%
- Price in Top Green Zone: TGT-2 achieved (- appears), full profit realized or trail T-SL for extended gains
- Price Approaching Black Zone: Warning! Stop loss near, consider early exit before full SL hit
BG Benefits for Swing Traders:
1. Instant Visual Clarity: See your risk-reward at a glance without calculations
2. Psychological Confidence: Large green zones relative to black zone boost conviction
3. Trade Selection Filter: Avoid trades with poor visual risk-reward
4. Real-Time Awareness: Always know where price is in your trade plan (gray - green - black)
Example Scenario:
- Screenshot 5 shows BANKNIFTY with BG active
- Top green zone (TGT-2 area at 58431.60) is largest
- Light green zone (TGT-1 area at 58270.60) is medium
- Gray zone (Entry at 58109.60) is moderate
- Black zone (SL at 57948.60) is smallest
- Visual assessment: Excellent risk-reward, proceed with confidence
Pro Tip:
Toggle BG ON before entering trades to visualize potential. Toggle BG OFF during active monitoring if you prefer clean charts with just price action. Toggle BG back ON periodically to reconfirm you're in the right risk-reward setup.
MW (MARKET WATCH) QUICK SWITCHER GUIDE
What is MW?
The MW (Market Watch) toggle is a game-changing productivity feature for swing traders managing multiple positions. It displays a bottom panel with 10+ clickable symbol buttons, allowing instant chart switching without manually searching for instruments.
How MW Works:
1. Click the MW button (cyan highlight when active)
2. Bottom panel appears showing all available symbols as blue buttons
3. Click any symbol button to instantly switch to that instrument's chart
4. Swing Trade indicator automatically loads data for the new symbol
5. View that instrument's current signal (BUY/SELL), targets, stop loss, and P&L
Available Symbols in MW Panel:
Based on screenshots, typical symbols include:
- Indices: BANKNIFTY, SENSEX
- Stocks: ASHOKLEY#, BIOCON#, MSIL (and more depending on your setup)
- Options: SC_77600, SC_77800, SC_78900, SP_77300, SP_77000, SP_76600
- Custom: MCRO (and any instruments you've configured)
Use Cases for MW Panel:
1. Multi-Position Monitoring:
Scenario: You have open swing trades on BANKNIFTY, SENSEX, and ASHOKLEY#
- Click MW - Symbol panel appears
- Click BANKNIFTY - View current P&L, check if TGT-1 hit
- Click SENSEX - View current P&L, check Trailing SL status
- Click ASHOKLEY# - View current P&L, monitor strength indicator
- Total time: 15 seconds (vs. 2-3 minutes manually switching charts)
2. New Signal Scanning:
Scenario: You want to scan multiple instruments for new swing trade opportunities
- Click MW - Symbol panel appears
- Click through 10-12 symbols rapidly (BANKNIFTY - MCRO - BIOCON# - etc.)
- Look for fresh BUY/SELL signals with favorable CPR/S&R positioning
- Identify 2-3 new trade candidates in under 1 minute
3. Expiry Date Management (Options/Futures):
Scenario: You trade multiple options contracts with different expiry dates
- Click MW - Symbol panel appears
- Click each options symbol (SC_77600, SC_77800, SP_77300, etc.)
- Check Expiry Tracker for each: "Exp 2026.09.05 | 30 Days Left"
- Close positions nearing expiry (< 7 days) to avoid theta decay
4. Sector Rotation Analysis:
Scenario: You want to compare signals across a sector (e.g., banking, pharma)
- Click MW - Symbol panel appears
- Click through sector stocks (BANKNIFTY, ASHOKLEY#, BIOCON#)
- Compare strength indicators (Weak vs. Medium)
- Identify which instruments show strongest momentum for next trade
MW Bottom Panel Layout:
- Two Rows of Buttons: Typically 6-9 symbols per row, organized alphabetically or by category
- Blue Highlighting: Each button has cyan/blue background for easy visibility
- Instant Response: Click any button - chart switches immediately (no loading delay)
Benefits of MW for Swing Traders:
- Time Savings: Switch between 10+ instruments in seconds (vs. manual symbol search)
- Reduced Errors: No typos when typing symbol names manually
- Comprehensive Monitoring: Keep track of multiple open positions effortlessly
- Opportunity Discovery: Quickly scan watchlist for new signal generation
- Professional Workflow: Mimics institutional trading dashboards with multi-symbol panels
Pro Tips:
- Keep MW panel open during market hours for rapid position monitoring
- Customize your symbol list (in indicator settings) to include only instruments you actively trade
- Use MW in combination with CPR/S&R/BG toggles: switch to a symbol, check CPR positioning, assess BG risk-reward
- For swing traders managing 5-10 concurrent positions, MW saves 30-60 minutes per trading day
Example Workflow:
1. Morning market open - Click MW
2. Scan all symbols for overnight gap moves (BANKNIFTY, SENSEX, stocks)
3. Identify 2-3 with fresh BUY/SELL signals
4. For each candidate: Activate CPR (check pivot positioning) - Activate S&R (check support/resistance) - Activate BG (assess risk-reward)
5. Select best 1-2 trades and execute
6. Throughout day: Click MW periodically to monitor all open positions.